
AMLX: Ph3 PBH Readout Less Binary Than It Looks
Three independent statistical frameworks suggest 3Q26 LUCIDITY readout is materially more derisked than prevailing investor confidence implies.

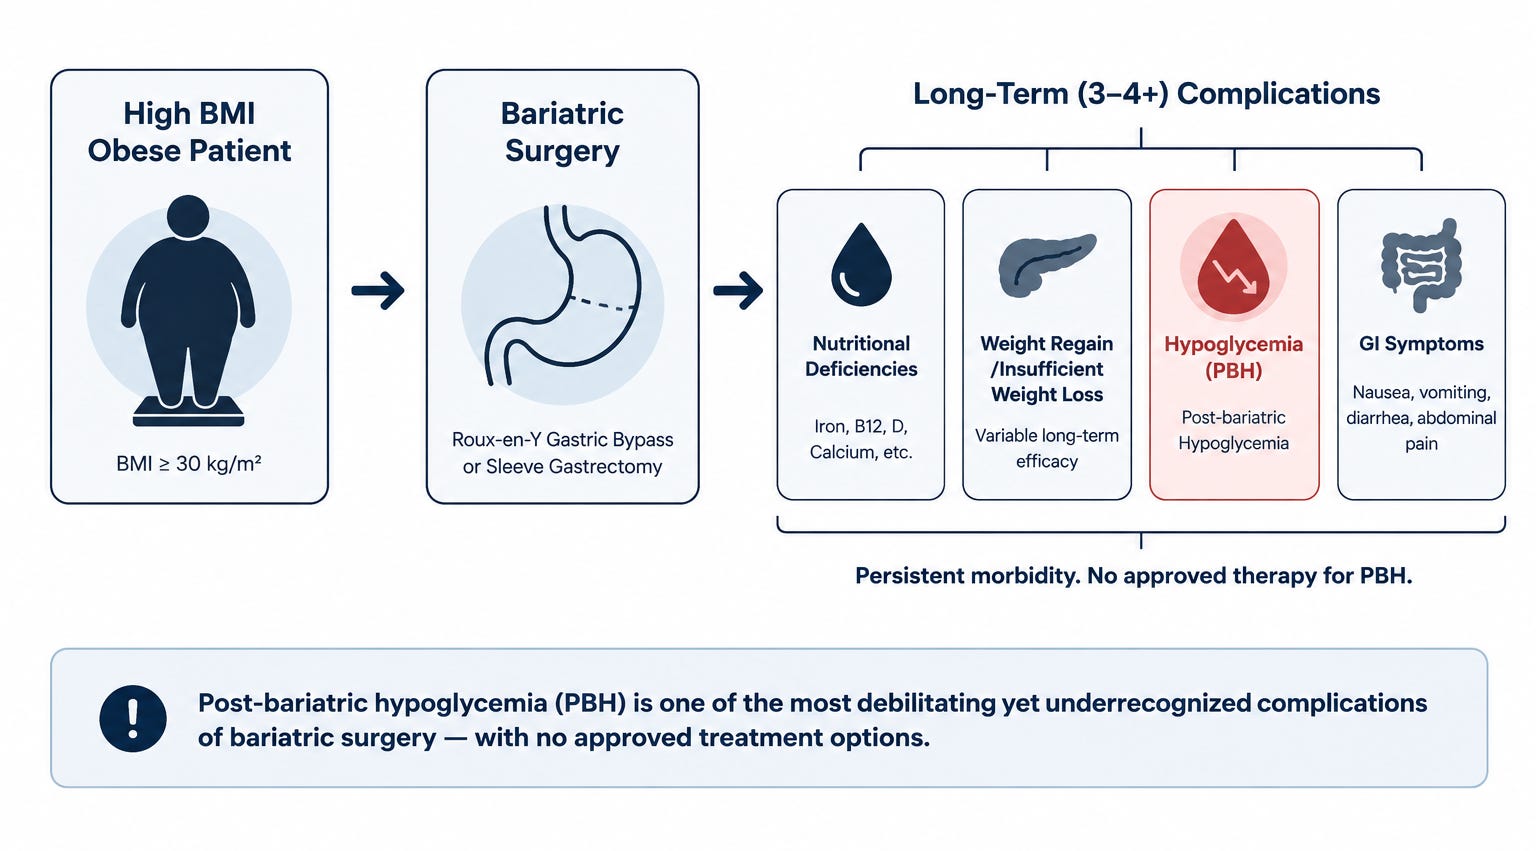
Post-bariatric hypoglycemia (PBH) has no approved therapy, a fragmented diagnosis pathway, and one of the widest gaps between medically important disease and recognized disease in endocrinology. Amylyx Pharmaceuticals (AMLX) is attempting to change that with LUCIDITY, a registration Ph3 study of avexitide expected to read out in Q3 2026. The market largely treats the catalyst as a binary outcome on a small orphan indication. We think that framing misses where the real uncertainty lies.
LUCIDITY answers only one question: whether avexitide works well enough for approval. The larger investment question is what approval would unlock. A therapy entering a disease that medicine systematically underdiagnoses creates value very differently from one entering a mature commercial market. The clinical hurdle can be quantified. The diagnosis infrastructure cannot.
This note addresses both. First, we reconstruct the expected statistical performance of LUCIDITY using two independent analytical frameworks that converge on similar Ph3 efficacy expectations, suggesting the dominant uncertainty is biological translation rather than sample size or statistical methodology. Second, we build a severity-stratified diagnosis funnel from first principles, showing that the medically important PBH population is substantially larger than the currently diagnosed population and that today’s valuation appears to underwrite only the latter.
1. PBH: The Hidden Disease
Post-bariatric hypoglycemia (PBH) is what happens when Roux-en-Y gastric bypass surgery permanently rewires gut anatomy and, with it, the GLP-1 signaling axis. Altered transit triggers an exaggerated GLP-1 surge after meals, which drives excessive insulin secretion, which drives recurrent hypoglycemia. The mechanism is well-characterized. The clinical recognition is not.
Three structural features make PBH systematically invisible to both medicine and investors.
Hypoglycemia unawareness: CGM studies detect hypoglycemia in ~54% of post-RYGB patients, but the majority experience no concordant symptoms. Patients who don’t feel low don’t present.
Specialty misalignment: post-bariatric follow-up sits with the bariatric surgeon, who is trained to manage weight and surgical complications — not to interpret a hypoglycemia pattern that looks like anxiety or dumping syndrome.
Coding failure: PBH has no clean ICD-10 home. It gets miscoded into E16.0 (drug-induced hypoglycemia) or E11.649 (T2D with hypoglycemia) — therefore, claims data structurally undercounts PBH prevalence.
Here is the inversion most investor notes have missed: GLP-1 drugs are compressing new bariatric surgery volume — ASMBS data shows annual procedures fell from a peak of ~230,000 in 2022 to ~177,000 in 2024 as patients trialed semaglutide and tirzepatide instead of going to the OR. Bears read this as a shrinking PBH incidence pipeline. The argument is backwards. GLP-1 agonists amplify the same receptor pathway that causes PBH in post-surgical patients. Every prior RYGB patient now prescribed a GLP-1 for residual weight regain is a patient at elevated risk of worsening hypoglycemia — and there are ~2.5M patients in US already. AMLX’s market doesn’t compete with GLP-1s. It inherits their complications.
2. When Does LUCIDITY Actually Read Out?
AMLX guides to “Q3 2026”. Operational reconstruction narrows that 13-week window to roughly three weeks.
The last participant was randomized on March 24, 2026. LUCIDITY’s 16-week double-blind treatment period puts Last Patient Last Visit (LPLV) around July 14-15. From there, topline follows a familiar sequence: data cleaning and query resolution (2-4 weeks), database lock (~1 week), statistical analysis (~1 week), and internal review before release (~1 week). For a well-run 78-patient trial, 4-7 weeks post-LPLV is the expected range.
The principal source of timeline variability is independent adjudication of Level 3 events. Unlike a simple biomarker endpoint, LUCIDITY requires Event Adjudication Committee (EAC) review before database lock, introducing a fixed operational step that explains management’s broad Q3 guidance rather than “early Q3.”
Our base case is a late August readout. With LPLV expected in mid-July, investors are looking at roughly 4-7 weeks of operational execution between the final patient visit and topline data, with independent Level 3 adjudication the principal source of timeline variability.
3. PBH: Why So Few Patients Are Diagnosed?
The more consequential question is what approval would actually unlock. Currently, reported PBH prevalence ranges from 0.1% to 55% in the literature, reflecting inconsistent definitions rather than genuine epidemiology. A market model built on that range can justify almost any conclusion.
The relevant population is the one FDA agreed to study in LUCIDITY: patients with composite Level 2 and Level 3 hypoglycemic events. Level 2 captures glucose <54 mg/dL regardless of symptoms; Level 3 requires severe neuroglycopenia requiring external assistance. In practice, this is the point where dietary modification and off-label therapy begin to fail, making it the commercially relevant population rather than simply the medically detectable one.
Getting the patient to the right specialist is the real bottleneck, not the prescription. Patients with recurrent hypoglycemia are typically seen first by bariatric surgeons, while diagnosis and treatment typically sit with endocrinologists. Many PBH patients never make that transition because recurrent hypoglycemia is mistaken for dumping syndrome or managed conservatively without specialist referral. AMLX’s expanded access program (EAP) - launched pre-readout for up to 250 patients - targets both bariatric surgery centres and endocrinology practices, attempting to build that referral pathway before launch. If successful, approval does more than add a new therapy. It expands the number of patients who are actually diagnosed.
The funnel below shows how that population narrows from the full post-RYGB pool to the medically important, severity-defined population — a bottom-up estimate directionally consistent with, though independently derived from, management’s claims-and-center-validated figure of ~160,000.
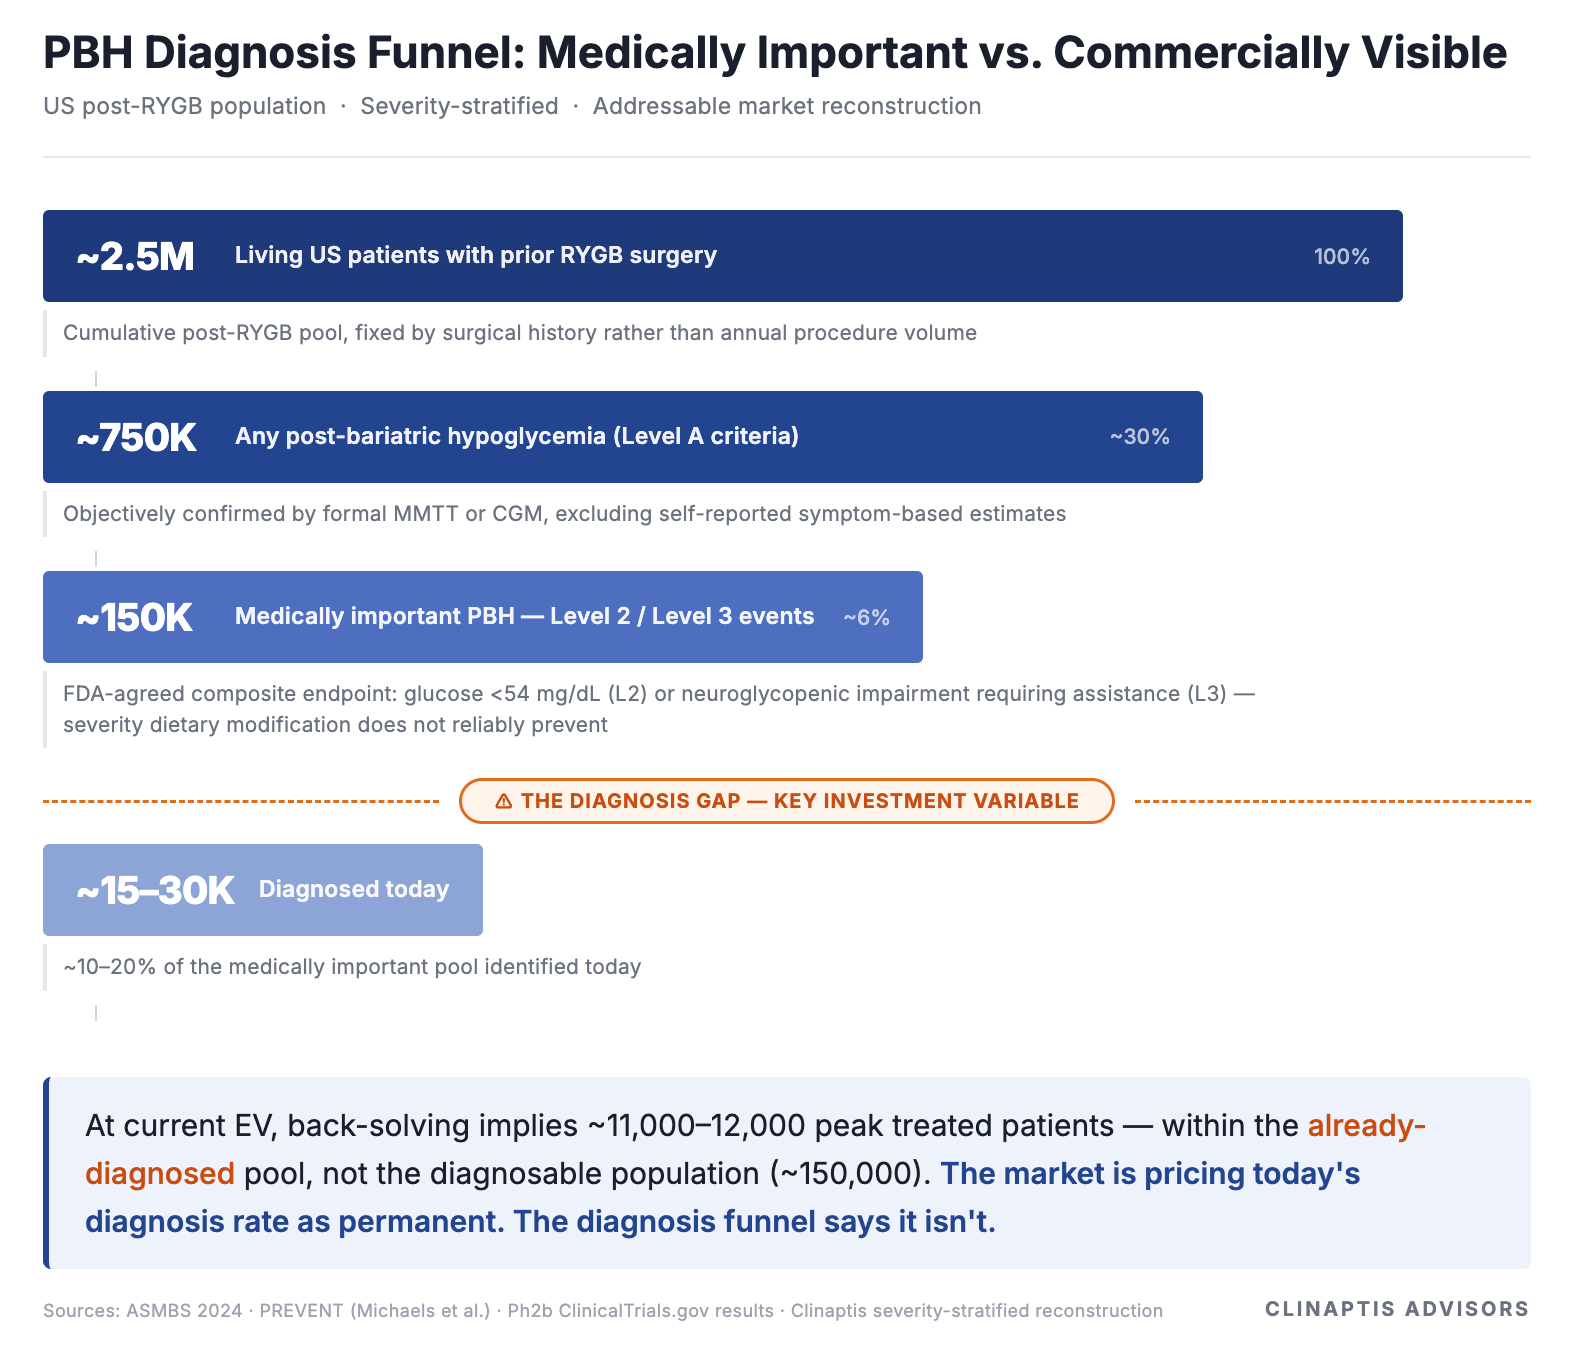
The Street is pricing the diagnosed universe. We think it should be pricing the diagnosable one. Avexitide approval, combined with the referral pathway AMLX is already building through its expanded access program, is the mechanism that begins to close that gap.
One final observation: the 2.5M post-RYGB population is fixed by surgical history, not this year’s bariatric procedure volume. Bears focused on GLP-1-driven declines in new surgery are modelling the wrong denominator. The relevant denominator already exists. The question is how many of those patients become diagnosed. Whether that gap closes depends on what LUCIDITY actually shows.
4. The Clinical Foundation for LUCIDITY
Avexitide has been evaluated across five clinical studies. Two matter most for LUCIDITY because they anchor its dose, endpoint, and population: PREVENT (Ph2, N=18, randomized placebo-controlled crossover) and Ph2b (N=16, open-label crossover, investigator-initiated, single-site — Stanford).
The endpoint itself has matured alongside the drug: PREVENT measured MMTT glucose nadir as an exploratory outcome, Ph2b measured CGM diurnal Level 2 events as a secondary endpoint, and LUCIDITY measures the composite Level 2 + Level 3 (L2/L3) rate as its FDA-agreed primary endpoint.
FDA’s choice of endpoint warrants a brief explanation: L2 events represent objectively confirmed biochemical hypoglycemia below the threshold of neurological impairment (glucose <54 mg/dL regardless of symptoms); Level 3 captures the functional consequence — neuroglycopenic impairment severe enough to require assistance from another person. Together they define the full clinical spectrum of hypoglycemia that dietary management alone cannot reliably prevent, measurable in an outpatient setting and clinically meaningful to patients. Neither depends on symptom self-report — the subjectivity that undermined earlier PBH endpoints.
Collectively, these studies show progression not simply in efficacy, but in regulatory maturity: exploratory endpoint → prospectively analysed secondary endpoint → FDA-agreed registration endpoint. That chain is exactly what Breakthrough Therapy Designation rewards and registration ultimately requires.
Ph2 efficacy anchor (90mg QD — the Ph3 dose):
The question is no longer whether avexitide has biological activity. It is whether that activity survives the transition from Ph2 to a registration trial.
Four observations matter for LUCIDITY:
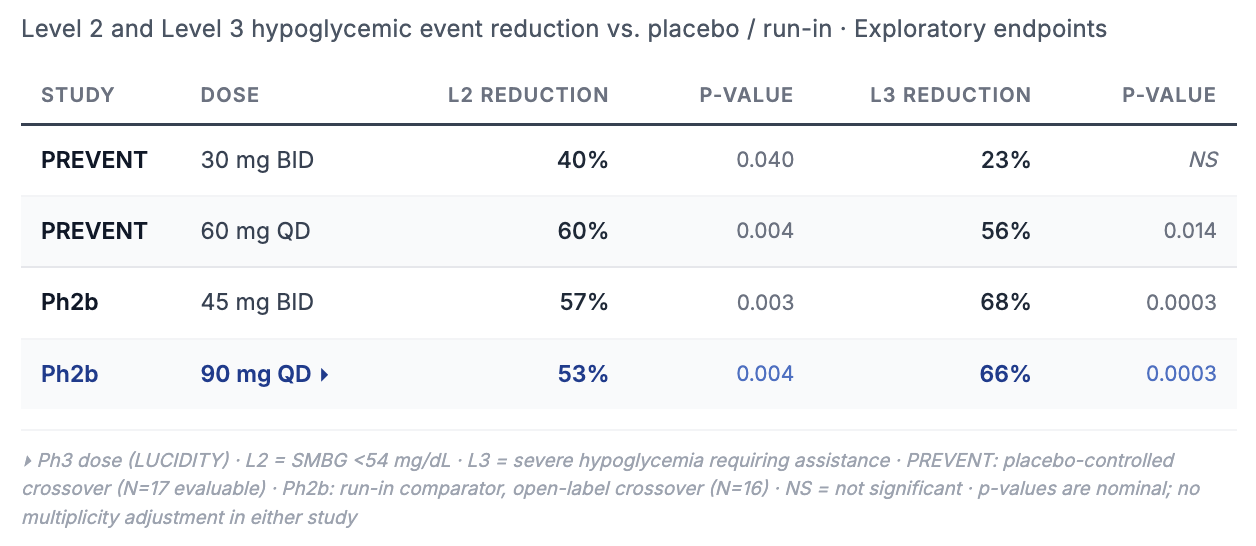
The dose-response is clean. 30mg BID showed 40% Level 2 reduction at borderline significance; 60mg QD showed 60% at p=0.004. That is pharmacology, not a statistical accident.
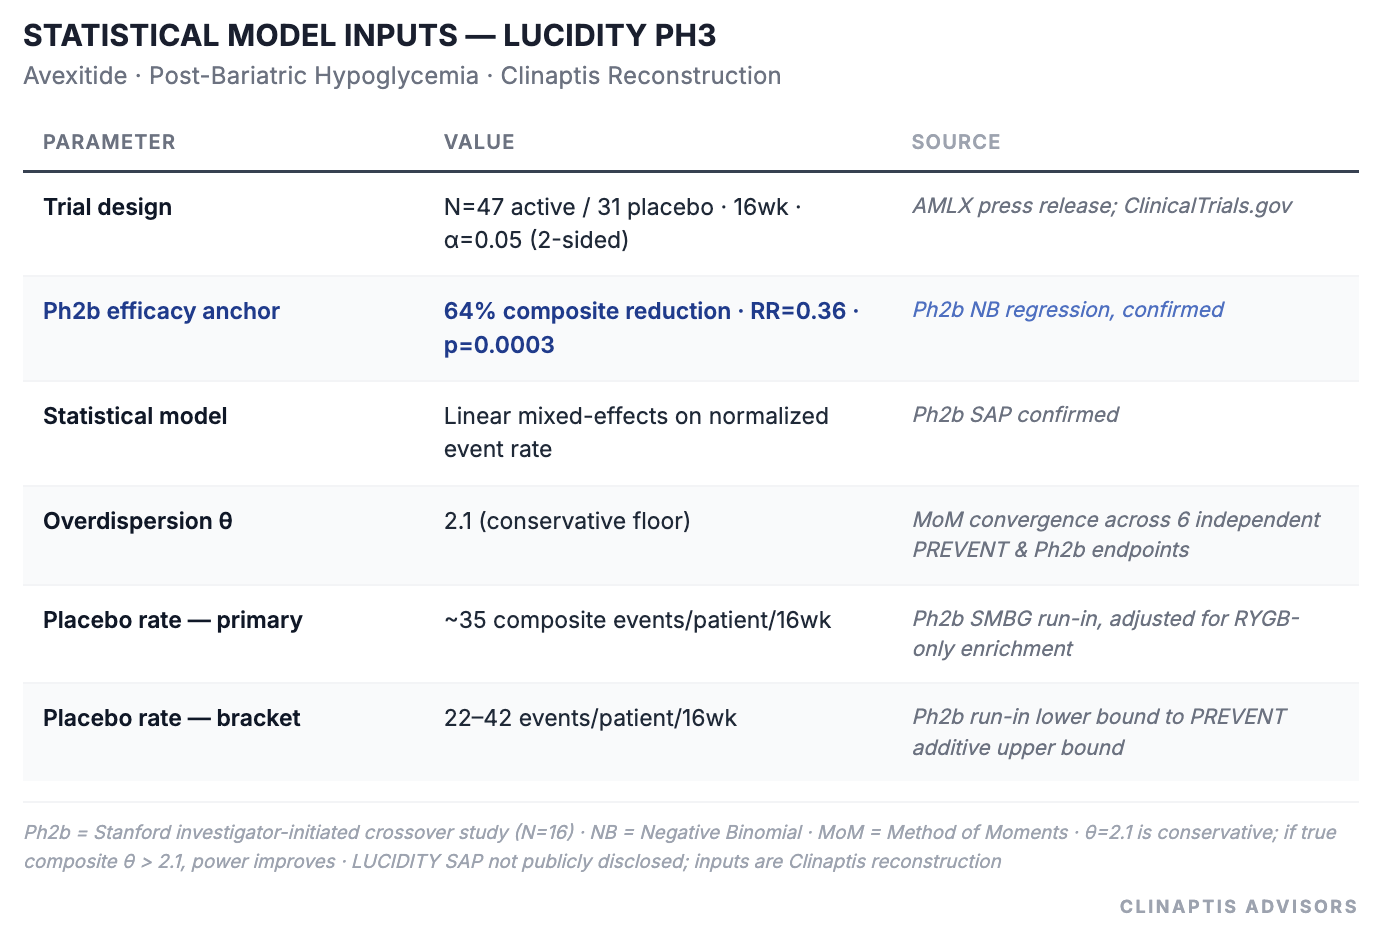
The Ph2b NB-confirmed composite reduction at 90mg QD is 64% — the anchor underpinning every power and probability-of-success estimate in Section 5. This is the single most important number in the Ph2 dataset.
The Level 3 asymmetry. In Ph2b, Level 3 reductions (66–68%) exceeded Level 2 reductions (53–57%). Severe events are typically harder to move than moderate ones; avexitide showing larger effects at the extreme end of the severity spectrum suggests the mechanism is most active where GLP-1 hyperstimulation is most pronounced — and would materially strengthen the label if it replicates in LUCIDITY.
The run-in comparator removes a confound. Unlike PREVENT, Ph2b used run-in rather than placebo (Pbo), reducing the behavioural changes that often accompany placebo observation. The resulting 64% estimate may therefore understate the treatment effect expected in LUCIDITY’s fully blinded, pbo-controlled design.
No credible near-term competitor exists in the registration pipeline. Avexitide would enter with no approved comparator — pricing power and formulary positioning at launch would be its alone.
The final question is whether these Ph2 results translate cleanly into the statistical framework used in LUCIDITY. The Ph2b SAP confirms a mixed-effects framework that adjusts for baseline event rates while accounting for repeated observations within patients. LUCIDITY is expected to use the same approach in a simpler parallel-group design, providing a modest statistical advantage over Ph2b.
5. The Statistical Case for LUCIDITY: Beyond Conventional Power Calculations
The funnel establishes what approval could be worth commercially. This section addresses whether approval is likely clinically. LUCIDITY looks small on headline N, but its statistical case is more quantifiable than a 78-patient trial implies: Ph2 placebo rates, confirmed overdispersion, and the Ph2b SAP allow us to reconstruct expected Ph3 performance despite the absence of a published LUCIDITY protocol or SAP. Two independent frameworks - a conservative negative-binomial reconstruction; and a baseline-adjusted SAP approximation - approach the same question from different directions.
Negative Binomial (NB) Regression Fits PBH Better Than Poisson
At 30% composite effect size — a clinically plausible Ph3 outcome given compression risks — Poisson gives 100% power and NB gives 57%. That 43-point gap comes entirely from model choice, not from the drug or the trial design.
The reason: Poisson assumes variance equals the mean. In PBH event data it doesn’t — across all six independent PREVENT and Ph2b endpoints, variance materially exceeds the mean (θ range 0.88–4.77), confirming substantial overdispersion. The negative binomial model corrects for this. It is the right model for this data, and it is the one we use throughout. Characterizations of LUCIDITY as either “risky” or “well-powered” are both technically defensible — and analytically useless — without specifying which framework is doing the work.
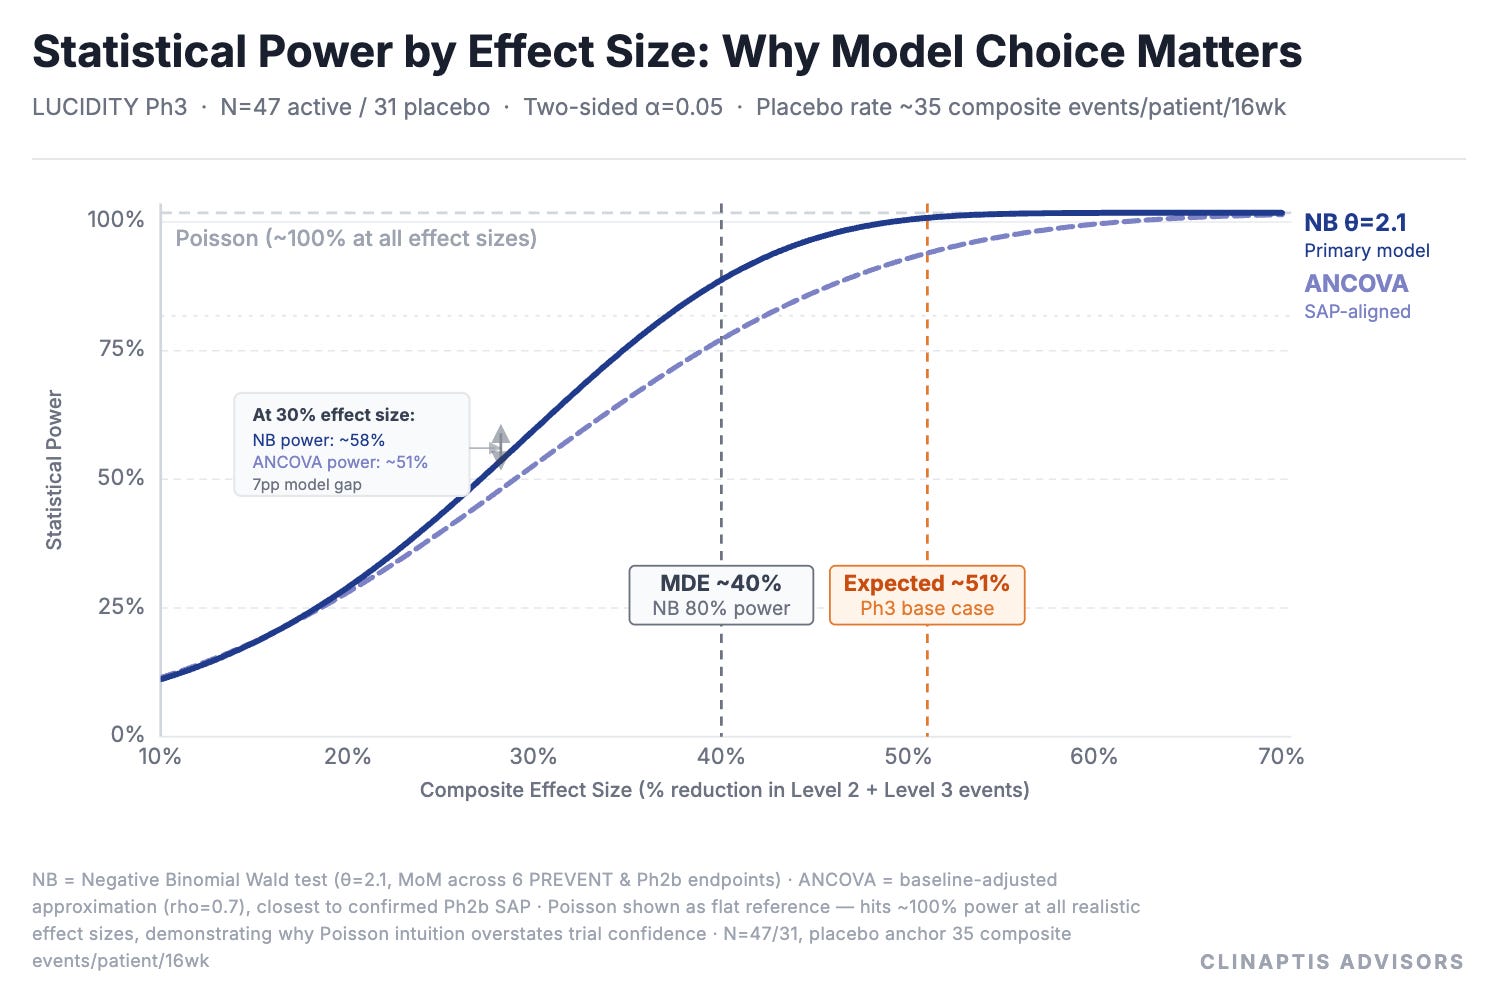
*ANCOVA sits below NB because it models absolute rate differences on the linear scale — less efficient than NB’s log-scale rate ratio at high event densities; rho=0.7 assumed.
Expected Ph3 effect size:
The Ph2b NB-confirmed anchor is 64% composite reduction. We apply a compression discount to account for three Ph3-specific risks: blinding effect (open-label Ph2b → double-blind LUCIDITY, typically 10–20% attenuation of observed effect); duration extension (28-day Ph2b → 16-week LUCIDITY, potential for regression to mean in a broader population); and site heterogeneity (investigator-initiated Ph2b → 20-site registration study).
Analogous data — dasiglucagon Ph3 essentially replicated Ph2 effect sizes; oncology cross-trial analyses suggest Ph2 effects average ~26% larger than Ph3 counterparts — together support compression toward the lower end of the range, though PBH is neither and the analogies are imperfect. We use 20% as the stated conservative base case; 10–15% is the central analogue-supported estimate.
Minimum detectable effect (MDE) and power:
Under the conservative NB model, the MDE at 80% power is ~40% composite reduction — and this holds across all placebo rate anchors from 22 to 42 events/16wk. That convergence across a near-2× event-rate range is a structural property of the trial design, not an artifact of any single assumption. ANCOVA-style baseline adjustment, which is closer to the confirmed SAP framework, places the plausible MDE range at ~35–45% depending on assumed baseline-post correlation. The true MDE sits somewhere in that bracket; the conservative NB figure of ~40% is the published anchor. Mgmt. disclosed 90% power at 35% effect size is consistent with the ANCOVA ceiling of this bracket, confirming the NB estimate is the conservative floor.
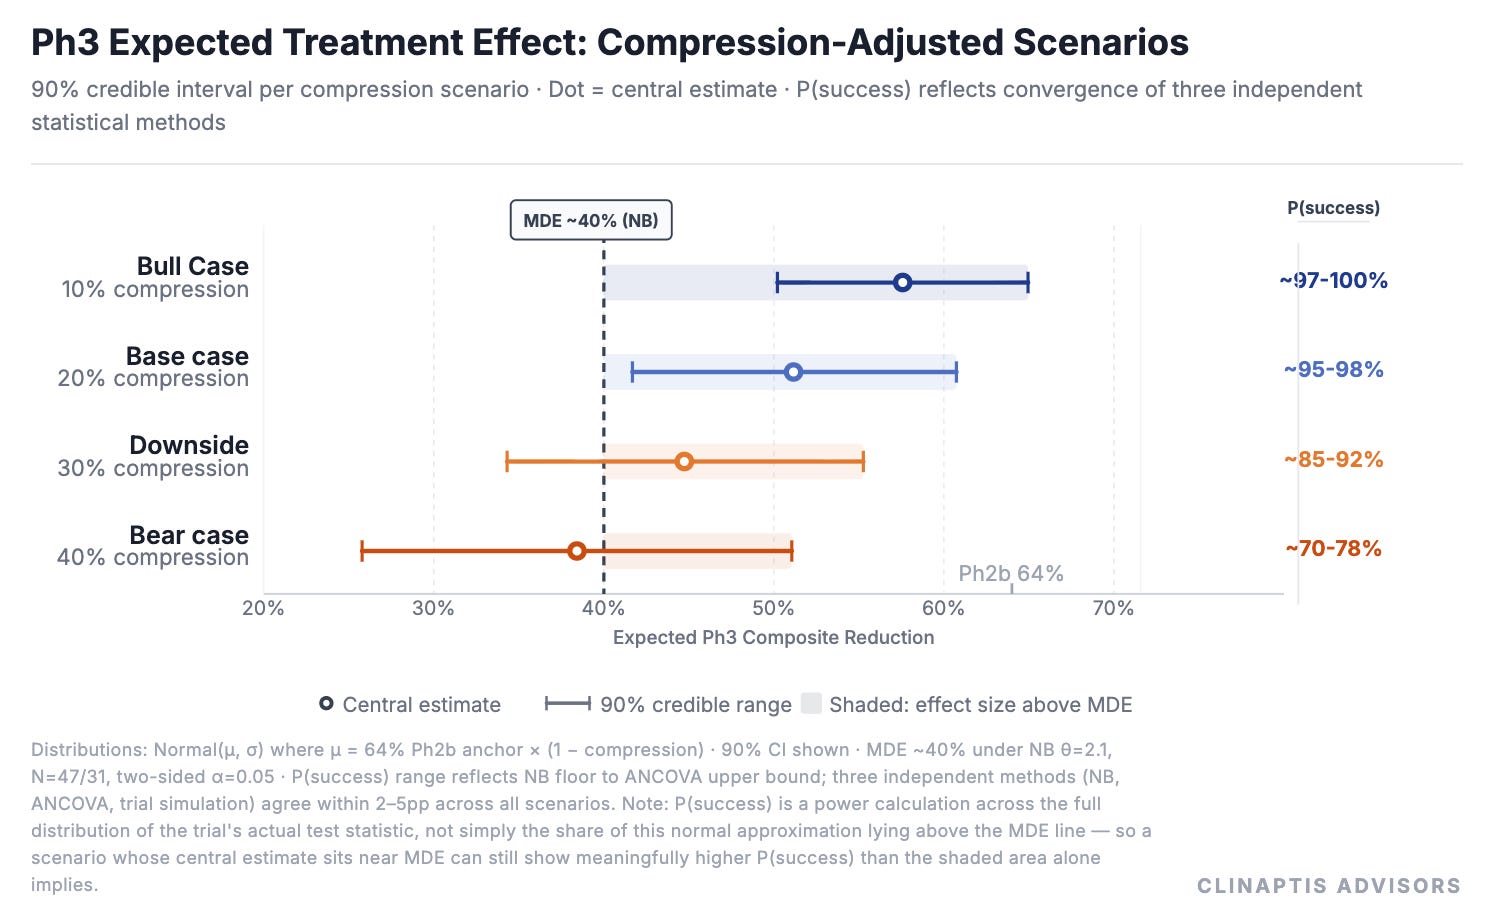
Compression is the expected shrinkage from Ph2b’s small, single-site effect size to what a larger, blinded, multi-site Ph3 is likely to show — the table below tests how much that shrinkage would have to be before the trial’s odds meaningfully change.
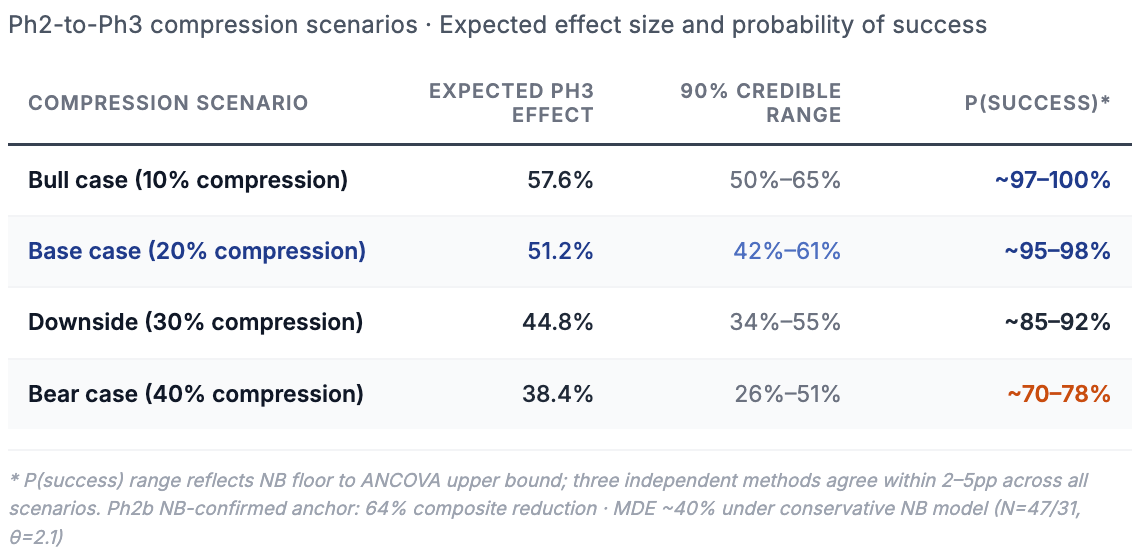
Three independent methods converge within 2–5pp across every compression scenario — NB reconstruction, ANCOVA approximation, and an independently reconstructed Ph3 trial simulation. Different anchors, different statistical structures, different placebo assumptions: same answer.
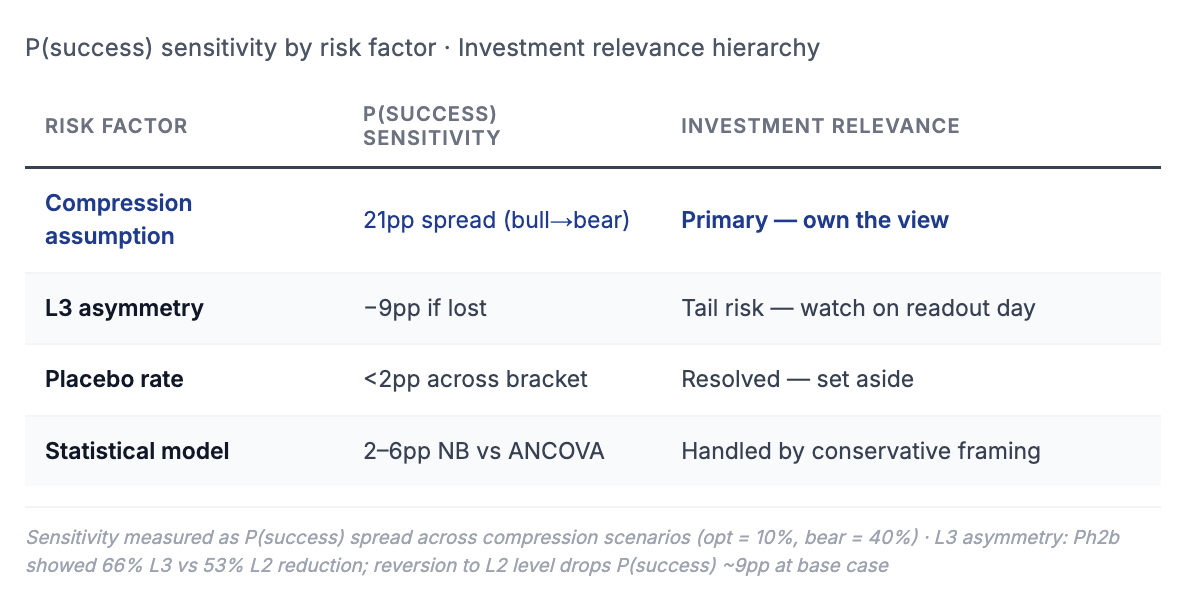
Three variables drive the uncertainty. One dominates.
Compression assumption creates a 21pp P(success) spread from optimistic to bear case. This is the only variable that materially moves the needle. Owning a view on Ph2-to-Ph3 efficacy translation is the core analytical judgment this note requires — everything else is second order.
L3 asymmetry creates a 9pp spread and is the number to watch on readout day. If Ph3 L3 reduction reverts to match L2 (53% rather than 66%), P(success) drops from ~95% to ~89% at base case. A partial reversal to 40% — plausible if LUCIDITY’s broader enrollment includes patients with milder Level 3 burden than Ph2b’s investigator-selected population — pushes it to ~78%. The asymmetry is not merely a label story; in tail scenarios it is a pass/fail variable.
Placebo rate can be set aside. Across a near-2× bracket (22–42 events/16wk), P(success) moves less than 2pp. Counterintuitively, higher placebo event rates improve power under NB — more events per patient tighten the rate ratio estimate — meaning LUCIDITY’s RYGB-only, stringent-run-in population is a power advantage, not a risk.
One risk the tables don’t capture: CGM monitoring during LUCIDITY may itself modify Pbo-arm behavior. Patients under continuous glucose observation — even blinded to treatment assignment — may tighten dietary patterns or reduce carbohydrate load, compressing the placebo event rate and shrinking the observed treatment contrast. The magnitude is unknowable without interim data, but it belongs in the bear case alongside compression and L3 asymmetry.
Finally, these risks are not independent. Compression, L3 asymmetry, and placebo behavior may move together in a miss scenario — a trial experiencing more blinding-related attenuation may simultaneously show weaker L3 effect and higher placebo improvement. The bear-case tail is fatter than any single sensitivity implies.
6. Valuation Scenarios
The statistical framework suggests that LUCIDITY is more quantifiable than a typical binary catalyst. Valuation therefore becomes the natural next question. If clinical success is more likely than the market implicitly assumes, the remaining task is to estimate what approval could be worth across a range of commercial outcomes.
Scenario inputs and outputs are summarized below; peak sales are modeled in Year 6 from commercial launch, discounted over Year 7 from today, consistent with the mid-to-late 2027 launch timeline established in Section 2. Pipeline optionality (~$300M, primarily congenital hyperinsulinism with its own BTD) is credited at present value in success cases; in a miss scenario, pipeline and platform assets are assumed to retain $200–300M of value at distressed multiples, reflecting cash on hand net of near-term burn.
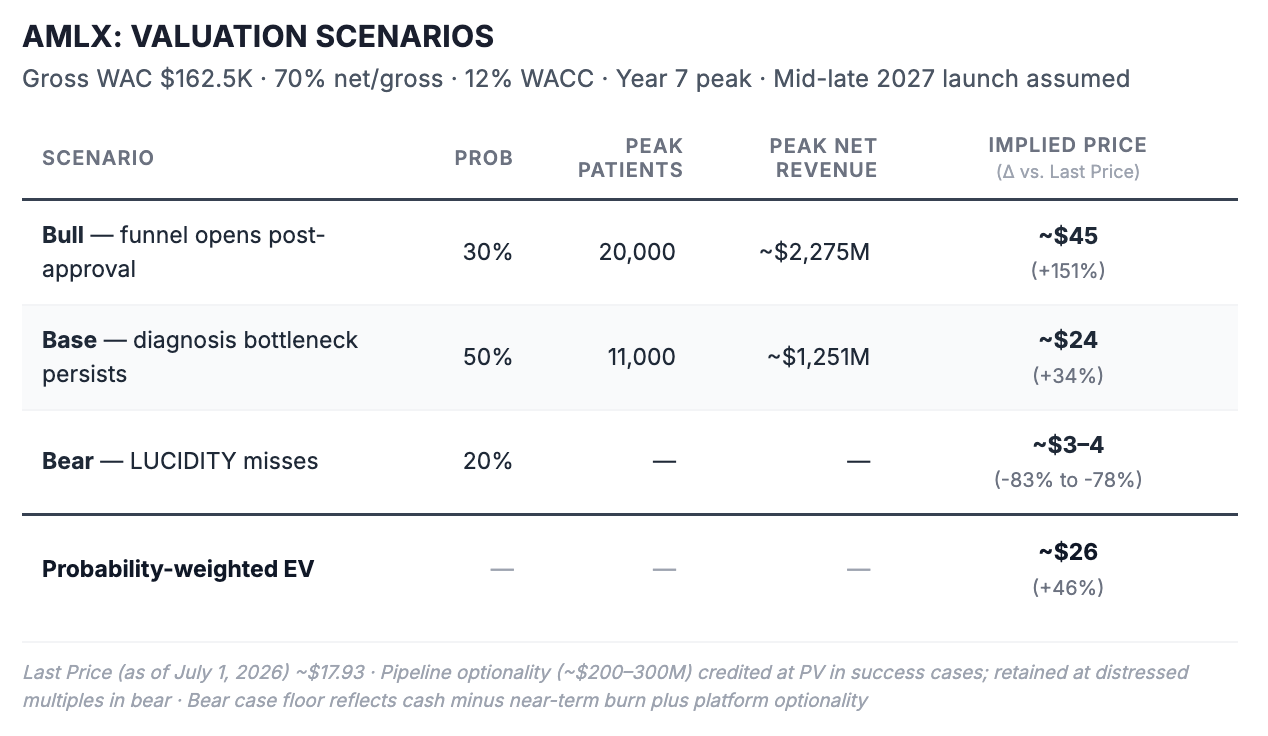
At current EV of ~$1,715M, back-solving at 70% approval probability — consistent with the statistical framework in Section 5 — a 4–4.5× revenue multiple, and net pricing of ~$114K/patient implies approximately 11,000–12,000 peak treated patients. That sits squarely at our base case penetration assumption. The stock is pricing penetration into today’s diagnosed market, but little if any penetration into the far larger diagnosable PBH population (~120,000-130,000 patients) that approval itself could begin to unlock.The modest upside case is whether approval begins expanding the diagnosis funnel — which is exactly what Breakthrough Therapy Designation, EAP rollout, and the structural GLP-1 inversion all argue is already in motion.
Approval itself expands the diagnosis infrastructure — by creating a reimbursable treatment pathway, giving endocrinologists a reason to screen for a disease they can now treat, and providing dedicated ICD-10 documentation, expected 2H26, that payers require for coverage. The commercial upside is not independent of the clinical outcome; it is activated by it.
Three variables drive the spread. Whether the diagnosis funnel opens post-approval is the single largest value lever, separating base from bull by ~$20/share — and it is a question approval itself begins to answer. Whether pricing holds at $150K+ gross is the second; penetration is already modestly reduced from the funnel ceiling to reflect 2–3 potential future competitors, so that risk is priced into patient share rather than price itself, since WAC is set before the competitive dynamic fully develops. Whether LUCIDITY hits at all is the third — the 20% bear case implies ~78–83% downside from current levels, with residual value reflecting cash net of near-term burn plus pipeline and platform optionality.
At today’s valuation, investors appear to recognize the possibility of approval, but not its likely consequences. If LUCIDITY delivers a clean Phase 3 win, our framework supports approximately 30-40% upside on approval alone. Everything beyond that depends on how quickly an invisible disease becomes a diagnosed market.
Bottom Line
LUCIDITY is more likely to succeed than a 78-patient trial implies. Two independent frameworks converge on P(success) of 91–98% at base case, the dominant risk is Ph2-to-Ph3 efficacy translation rather than sample size arithmetic, and five trials of consistent data make a complete pharmacological failure implausible. On readout day, watch Level 3 reduction — not the headline p-value. If avexitide replicates the Ph2b asymmetry, the drug works most where the disease is worst, which is exactly where the label is most compelling and payer resistance is lowest.
The harder question is commercial. Back-solving from current EV implies the market is pricing approximately 11,000–12,000 peak treated patients at 70% approval probability — penetration into the already-diagnosed pool, nothing more. Our funnel puts the medically important PBH population at ~150,000. The gap between those two numbers is not a disagreement about the drug. It is a disagreement about whether approval begins converting an invisible disease into a diagnosed market.
The Street prices the diagnosed universe. We think it should increasingly price the diagnosable one. Despite only two small and necessarily imperfect Phase 2 datasets to work from, reconstructing LUCIDITY from first principles ultimately left us more confident in avexitide’s clinical and regulatory value proposition than when we began.
Disclaimer
This publication has been prepared by Clinaptis Advisors for informational and educational purposes only. It does not constitute investment advice, investment research, an offer or solicitation to buy or sell any security, or a recommendation regarding any investment strategy or financial instrument. The opinions expressed reflect the author’s views as of the publication date and are subject to change without notice.
Clinaptis Advisors is not a registered investment adviser, broker-dealer, or licensed financial professional. Readers should conduct their own independent due diligence and consult qualified financial, legal, tax, and other professional advisers before making any investment decision. Investing in publicly traded securities involves substantial risk, including the possible loss of principal.
Unless otherwise stated, factual information has been derived from publicly available sources, including company filings, earnings calls, regulatory documents, clinical trial registries, scientific publications, and other publicly available materials believed to be reliable. While reasonable care has been taken in preparing this publication, no representation or warranty, express or implied, is made regarding the accuracy, completeness, or timeliness of any information contained herein. Estimates, projections, scenario analyses, statistical reconstructions, valuation models, and other forward-looking statements represent the author’s independent analytical judgments and are inherently uncertain.
Copyright © Clinaptis Advisors. All rights reserved. This publication, including its original analytical frameworks, statistical methodologies, valuation models, graphics, figures, visualizations, tables, written content, and proprietary research, constitutes the intellectual property of Clinaptis Advisors and may not be reproduced, redistributed, quoted extensively, republished, or incorporated into derivative works without prior written permission, except for brief quotations with appropriate attribution.
METHODOLOGY NOTE
“Statistical analysis in Section 5 draws on three independent frameworks: a conservative Negative Binomial reconstruction and SAP-aligned baseline-adjusted approximation as analytical bounds, and an independently reconstructed trial simulation as empirical confirmation. First, an analytical negative binomial reconstruction: power calculations use a NB Wald test (θ=2.1, method-of-moments convergence across six independent PREVENT and Ph2b endpoints) as a conservative floor, and an ANCOVA approximation (baseline-adjusted, rho=0.7) as the likely ceiling, bracketing LUCIDITY’s actual mixed-effects SAP. ANCOVA sits below NB in the power curve because it models absolute rate differences on the linear scale — less efficient than NB’s log-scale rate ratio at high event densities, making it the conservative bound of the bracket. A 20% compression discount applied to the Ph2b NB-confirmed composite anchor of 64% reflects attenuation from open-label to blinded design, 28-day to 16-week duration, and single-site investigator-initiated to 20-site execution.
Second, a simulation framework built from repeated stochastic draws of endpoint-specific Ph2 efficacy (L2=52%, a point estimate within Section 4’s 53–57% observed range; L3=63%), human-derived NB event distributions (θ=4.77 L2, θ=2.13 L3), and a ~15% placebo improvement assumption. The framework was developed iteratively to approach the rigor of the sponsor’s own SAP: patient-level event generation was built around individually-varying baseline run-in rates and surgery-type composition (RYGB vs. other, mirroring the Ph2b design) rather than a single population-level rate, with baseline-adjusted treatment effects applied at the patient level and site-level enrollment variability layered in to stress-test robustness under realistic multi-site execution.
Pre-compression composite of ~57.5% converges with the analytical base case of 51.2% after applying 10–15% compression, confirming both frameworks are consistent. Published expected Ph3 range: 49–58% composite reduction. Three-method P(success) convergence within 2–5pp across all compression scenarios. LUCIDITY’s SAP has not been publicly disclosed; all figures are probabilistic reconstructions, conditional on avexitide having a real pharmacological effect — supported by five-trial consistency across two independent study programs.
Dispersion parameter θ=2.1 is a conservative floor derived from method-of-moments estimation across six independent endpoints; if the true composite θ exceeds 2.1 — plausible if L2 and L3 events are positively correlated within patients, reducing composite heterogeneity — power improves. Placebo rate bracket (22–42 composite events/patient/16wk) constructed from Ph2b SMBG run-in as lower bound (22.2, mixed surgical population), midpoint adjusted upward for RYGB-only enrichment (35.0, primary anchor), and PREVENT additive sum as upper bound (31.8, known overcount); P(success) moves <2pp across this full range.