
BIIB Alzheimer’s: CELIA Validated Tau, Not the Clinical Effect Size
The reported 26% slowing likely overstates the underlying effect. That does not mean Biogen chose the wrong dose.

Biogen (BIIB) fell 8.8% on Tuesday to $190.58 — the steepest drop since March, handing back Monday’s Leqembi subcutaneous approval rally twice over. Ionis (IONS), which discovered the molecule and holds the royalty, fell 3.3%. The company had just called the dataset proof of concept for the most important new mechanism in Alzheimer’s disease (AD) - after amyloid.
The sell-side landed in the same place within a day. Tau is validated. The 60 mg arm looks competitive with the anti-amyloid antibodies. The inverted dose-response reflects a therapeutic window, or a tolerability ceiling, or something else nobody can name yet — and the Street has spent this week asking why the lowest dose won.
Nothing won. No dose in CELIA can be distinguished from any other. The entire dose-ranging result is roughly one standard error wide, and the 26% clinical benefit now anchoring consensus is the largest of three noisy estimates drawn from the smallest arm (n=60) in the study — an arm Biogen gave half the patients of every other. Reconstruct the trial’s own error bars and the defensible effect is ~0.29 points on CDR-SB, ~14% slowing, against a headline of 0.54 and 26%. The consensus line that 26% is comparable to Leqembi and Kisunla sets Biogen’s best-of-three arm against lecanemab’s confirmatory Phase 3 estimate of 0.45 and 27%. Like for like, diranersen’s honest effect is about half.
And 60 mg is still probably the right Phase 3 dose. We are challenging the confidence of the evidence, not the correctness of the decision. That distinction is the note — Phase 3 will be sized on the evidence, not on the decision.
I. The setup
Amyloid is settled. Tau is the whole option value.
Lecanemab (Leqembi, Eisai/BIIB) won traditional approval in July 2023 on CLARITY AD, slowing CDR-SB decline 27% over 18 months — 0.45 points (95% CI 0.23–0.67). Donanemab (Kisunla, Lilly) followed in 2024. The mechanism works. That is why the money moved to tau: tau PET predicts where neurodegeneration will occur a year or more in advance, while amyloid burden plateaus early and correlates poorly with symptoms. Tau sits downstream of amyloid, which makes it potentially additive to an antibody rather than a replacement for one — and Biogen is the only company holding both ends.
Monday’s subcutaneous approval took the last delivery problem off the table. What Biogen’s Alzheimer’s franchise has left to sell is efficacy — which is what diranersen is being asked to supply.
Tau has been a graveyard, and diranersen was engineered against the reason. Semorinemab, tilavonemab and Biogen’s own gosuranemab all chased extracellular tau — a compartment the disease does not primarily live in. Diranersen (BIIB080) is an antisense oligonucleotide targeting MAPT mRNA: it cuts tau production inside the cell, upstream of aggregation — and the toxic species is increasingly understood to be soluble oligomeric tau, not the tangles PET can see. Different target, different compartment, different modality — which is why the biomarker result below reads on the platform, not just the compound.
II. What P2 CELIA showed
The biology is unambiguous. The clinical result is not.
CELIA randomized 416 anti-amyloid-naive patients with MCI due to AD or mild AD dementia across three intrathecal regimens over 76 weeks, allocating 2:1:2:2. The arms as reported total 406 — placebo (n=115), 60 mg Q24W (n=60), 115 mg Q24W (n=115), 115 mg Q12W (n=116) — a ten-patient gap the deck does not reconcile. The 60 mg arm enrolled half as many patients as every other arm (Nov. 2024 ClinicalTrials.gov update), including half as many as placebo (60 vs. 115). It is the trial’s single most consequential design choice.
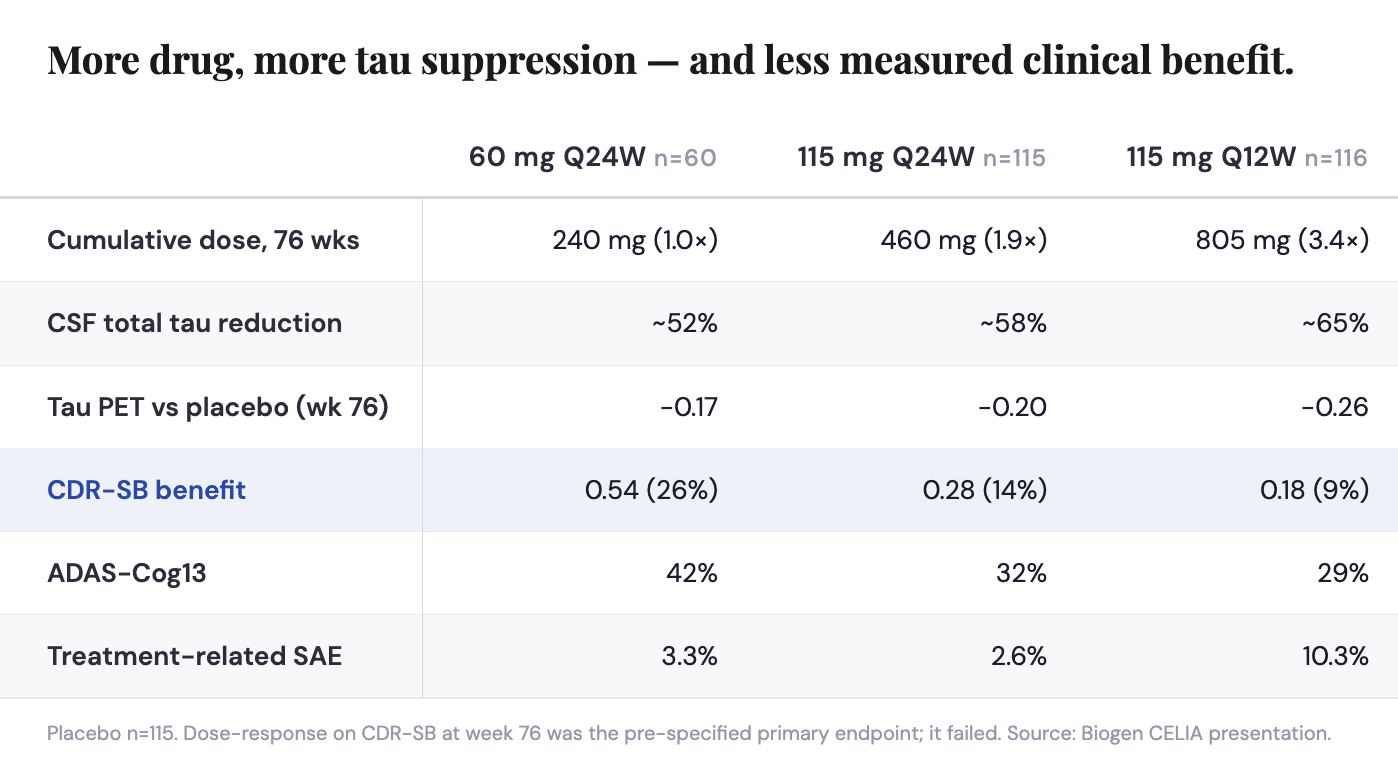
CSF tau falls within 12 weeks in every arm and separates cleanly by dose with tight 95% CIs; tau PET shows placebo-adjusted separation in every evaluated region. Diranersen is the first tau-directed agent to move both fluid and imaging tau in a Phase 2 — and the first convincing clinical signal for RNA-level intervention against a CNS proteinopathy. That is the read that IONS holds the royalty on, and a 3.3% sympathy move did not price it.
Safety beat expectations: procedural adverse events only — post-LP syndrome, procedural pain, transient confusional state resolving within a week — and no ARIA, by mechanism. More than 90% of completers elected the extension, a revealed-preference datapoint on intrathecal burden no survey could produce.
The primary endpoint — dose-response on CDR-SB at week 76 — failed. Biogen is advancing to Ph3 anyway, on 60 mg.
Every biological measurement in that table is monotonic in dose; the clinical column is inverse-rank-ordered in dose. One of those patterns is measurement. The other is scatter.
III. The teardown: Reconstructing the error bars
Biogen published point estimates and withheld precision. So we reconstructed it. Three findings follow.
No dose can be distinguished — from placebo, or from any other dose.
The 26% headline likely overstates the underlying clinical effect.
Two independent methods converge on ~0.29 points CDR-SB (~14% slowing) — roughly half the headline.
The rest of this section proves them.
A. The reconstruction
No confidence intervals appear anywhere in the presentation for the clinical endpoints. The company says only that “the majority of these endpoint differences achieved nominal statistical significance” — five endpoints listed, so at least two did not. It never says which.
But the presentation disclosed something equally useful. The clinical figure reports adjusted mean change from baseline ±SE — Biogen’s label on Biogen’s axis, not our assumption about what the error bars mean. Digitizing the curves against those reported standard errors reconstructs the underlying variance. The question is whether the published point estimates are internally consistent with the precision Biogen plotted.
Digitizing the 60 mg arm gives SEs of 0.198, 0.238 and 0.293 at weeks 24, 48 and 76; placebo gives 0.195 and 0.235 at weeks 48 and 76. Our reconstruction implies a CDR-SB change SD rising from ~1.5 to 2.27 over 18 months. CLARITY AD back-solves to SD = 2.33 (0.45; 0.23–0.67; n=859/875) — same endpoint, same duration, adjacent population, best-characterized dataset in the field. They agree to within 3%. A digitization error large enough to matter would not land that close to an independently published answer.
B. The result
Apply those standard errors to the reported treatment differences and every comparison in the trial can be tested. The table below is the sponsor’s point estimates against our reconstructed precision; the figure is the same thing drawn.
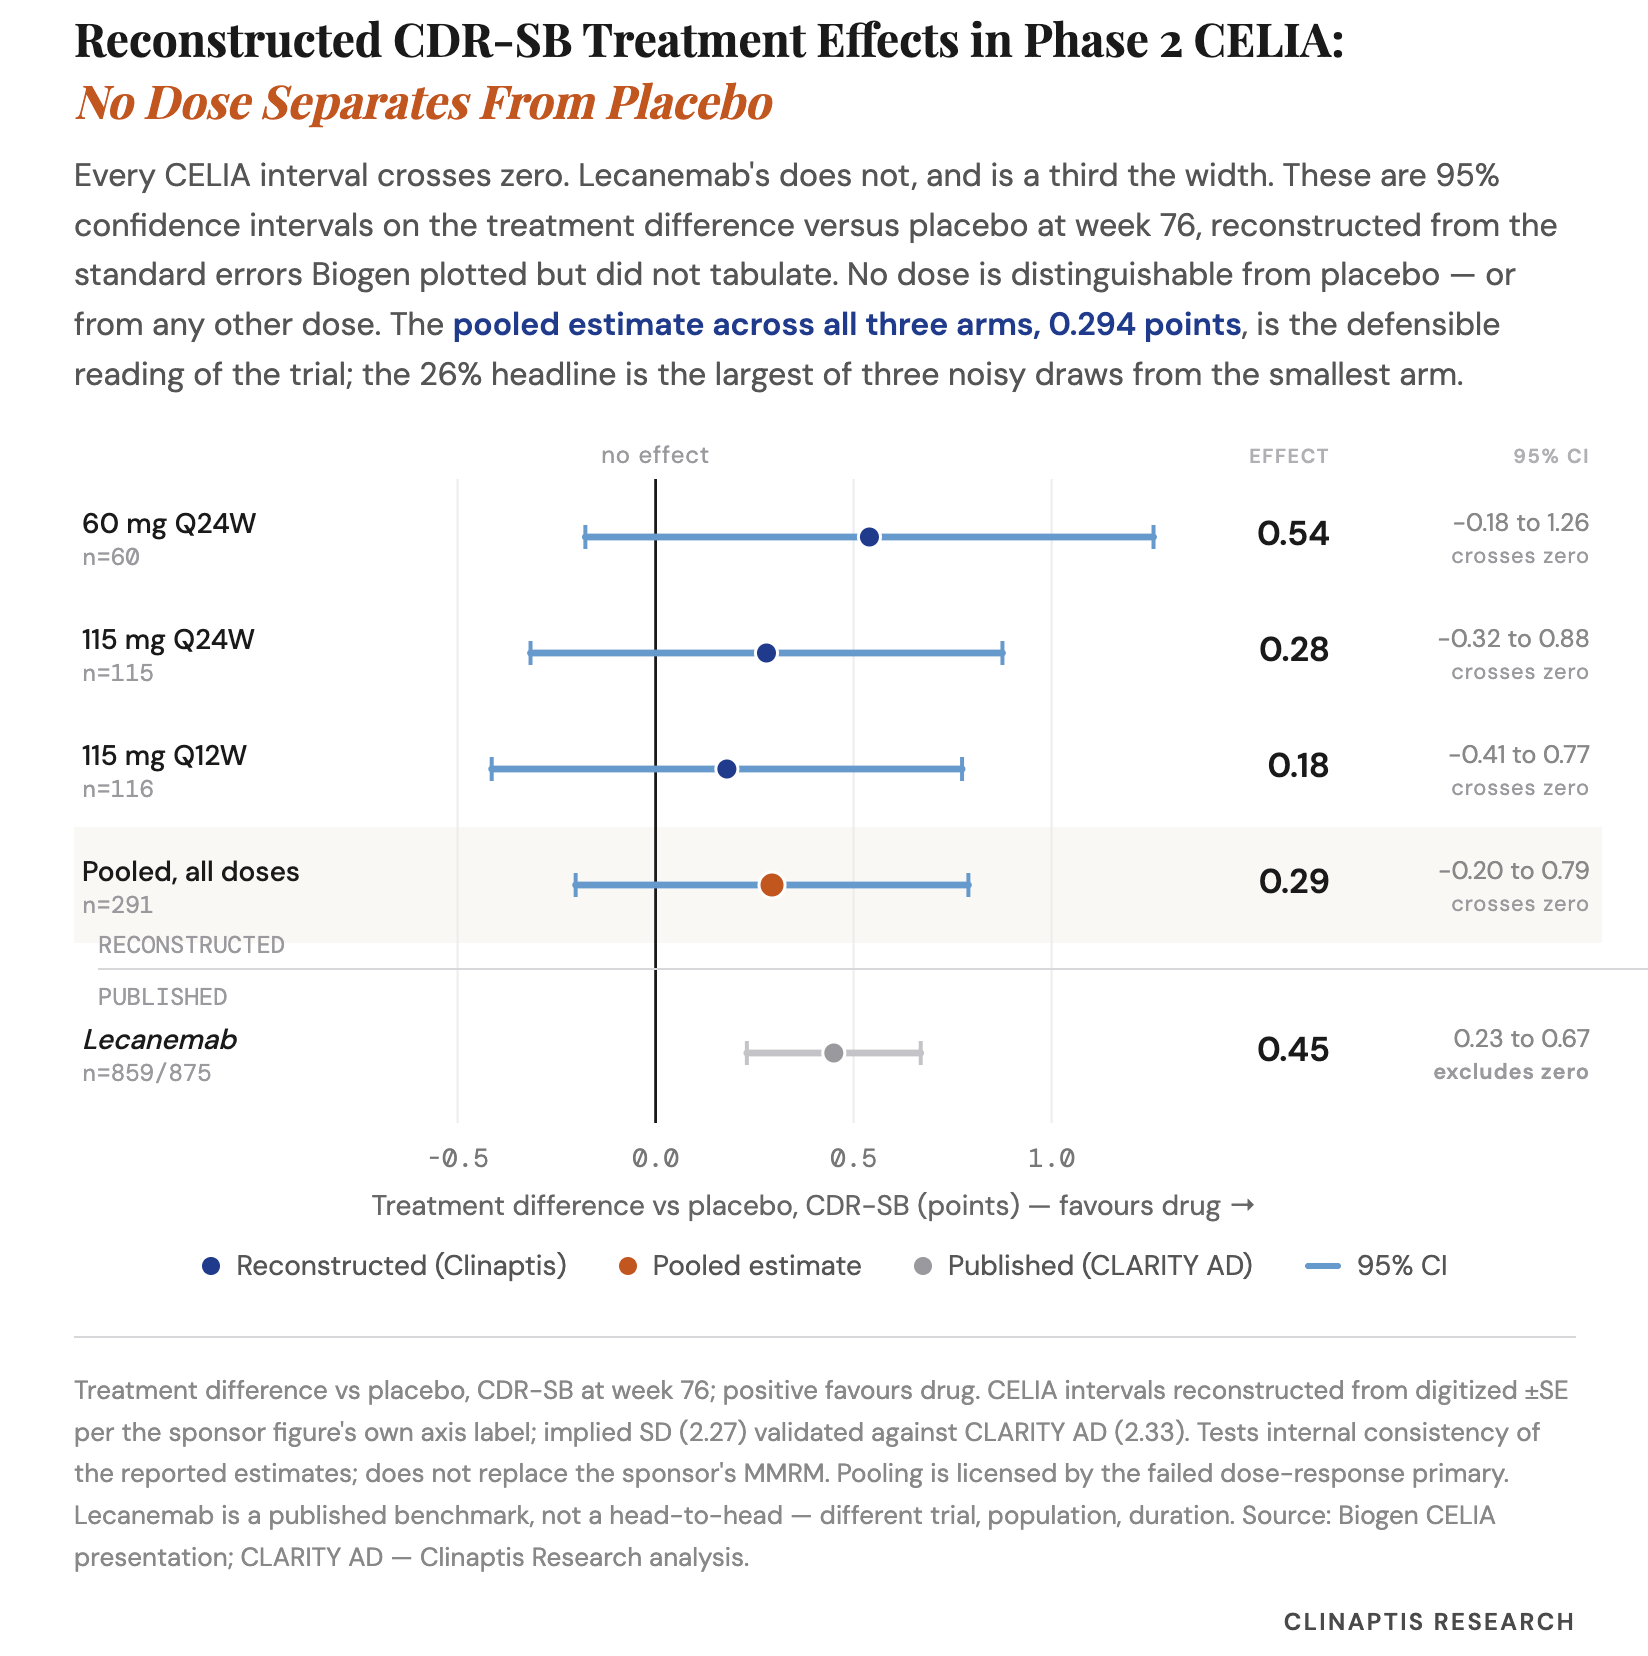
Every CELIA interval crosses zero. Lecanemab’s does not, and is a third the width.
Finding 1: 0.54 probably isn’t nominally significant on Biogen’s own error bars
For p<0.05, z ≈ 1.96, so the model-derived SE would have to be 0.54 / 1.96 = 0.276 against the 0.366 the plotted arm SEs imply — 25% tighter than the figure suggests. Covariate adjustment can buy some of that. It is unlikely to buy all of it.
Biogen’s own framing is consistent: “slowing of clinical decline on the cognitive endpoints — 42% on ADAS-Cog13 and 50% on MMSE — alongside a 26% slowing on CDR-SB.” The larger numbers lead. CDR-SB — the endpoint every approved AD drug was licensed on — is demoted to an appositive. Whether ADAS-Cog13 or MMSE cleared nominal significance, the deck does not say: for MMSE it gives baselines (24.5, SD 3.2 vs 24.6, SD 3.1) and a relative slowing, nothing else. So we leave the ordering where Biogen put it.
Finding 2: the arms differ by less than one standard error
Best arm versus worst: z ≈ 0.98, p ≈ 0.33. The window the Street is theorizing about is one standard error wide across three arms, and scatter of ~1σ needs no biological mechanism. Occam disposes of it.
This looks selective — you accept a dose-response in the biomarkers and dismiss it in the clinic. CSF tau moves 52% to 65% against within-arm variance small enough that the 95% CIs don’t overlap. CDR-SB moves 0.18 to 0.54 points against an SD of 2.27 — a signal one-tenth the size of its own noise. The same true dose-response would be unmissable in one instrument and invisible in the other. Only one of them could resolve it either way, and it isn’t the one the Street is arguing about.
Finding 3: the defensible effect is ~0.29 points, half the headline
Biogen’s pre-specified primary — dose-response on CDR-SB — failed. A failed dose-response leaves no statistical basis for privileging any single arm over the others, so pool them: the n-weighted effect across all three is 0.294 points. The scope is narrow. Pooling assumes an identical clinical effect, not identical biomarker suppression; 52% versus 65% CSF tau is a real pharmacological difference that produced no detectable difference in cognition, which is what the failed primary reports.
Then the winner’s curse. Select the maximum of several noisy draws and you have selected partly for effect, partly for favorable noise. The expected maximum of three draws sits ~0.85σ above the true mean; correct 0.54 and you get ~0.27. The two share no machinery, and they land within 0.02 of each other. We carry the pooled 0.29 points, ~14% slowing, as the more conservative.
n=60 is why both corrections bite: half the patients, √2 wider SEs, more room for a favorable draw. The smallest arm in the study was the one most likely to produce the largest number by accident. It did, and that number is now consensus.
IV. The shape of disease modification in AD
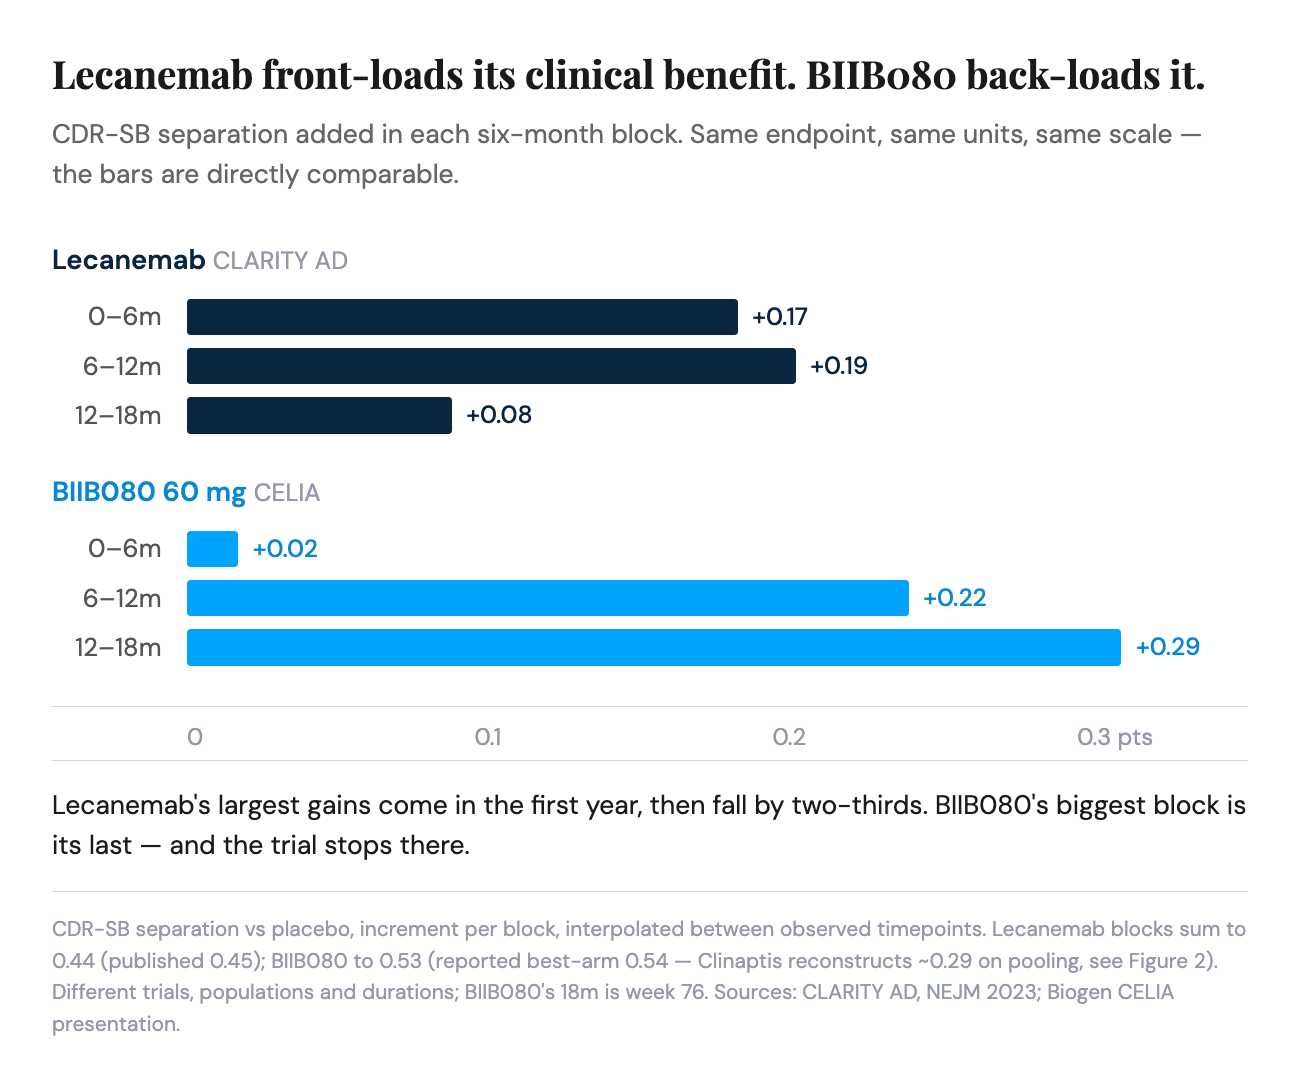
Both classes front-load the biology and back-load the cognition. They diverge in the second derivative — the only cross-class statement CELIA can support.
Not an efficacy comparison: different populations, endpoints, durations and units. Jointly the two datasets answer one structural question — what shape does disease modification have?
Lecanemab clears amyloid −19.6 CL by month 3 and −55.6 by month 18, most of it by month 12; diranersen 60 mg suppresses CSF tau 25% by week 12 and is near-floor by week 60. Neither clinical curve does anything comparable early. Pathology-precedes-cognition is not an amyloid property. It looks like a property of disease modification.
The divergence comes after the biomarker saturates. Lecanemab’s benefit is front-loaded and then decays by two-thirds; diranersen’s largest block is its last, and the trial stops there. On absolute separation both look progressive. On rate they are opposites.
Placebo does the work in tau PET. Lecanemab’s amyloid separation is ~94% drug-driven; diranersen 60 mg’s from weeks 54 to 76 is placebo accumulation against a stable drug curve. Same-looking widening, different mechanism. Only 115 Q12W keeps moving down — a durability question at Q24W dosing, not a translation finding.
More drug does not appear to help. More time might — and CELIA is no evidence that more tau suppression is better tau suppression.
V. Why 60 mg is probably right anyway
The dose is defensible. The efficacy narrative Biogen used to defend it is not. Those are separable, and Biogen chose the weaker of the two arguments available to it.
Set the clinical table aside — it is the noisiest instrument in the study and points significantly in no direction. The case for 60 mg is made without it:
Saturating biology. CSF tau suppression runs 52% → 58% → 65% across 1.0× → 1.9× → 3.4× cumulative dose; tau PET runs −0.17 → −0.20 → −0.26. Monotonic and decelerating: 3.4× the drug buys 1.25× the suppression — a curve whose useful range is already entered at the bottom.
Tolerability. Treatment-related SAEs of 3.3% and 2.6% at Q24W against 10.3% at Q12W — a fourfold step for the marginal 13 points of suppression above.
Burden. Two lumbar punctures a year versus four, in a Phase 3 that must enroll thousands and hold them 18 months or more. Intrathecal delivery is the asset’s central commercial liability; halving the procedure count is not a rounding error in feasibility.
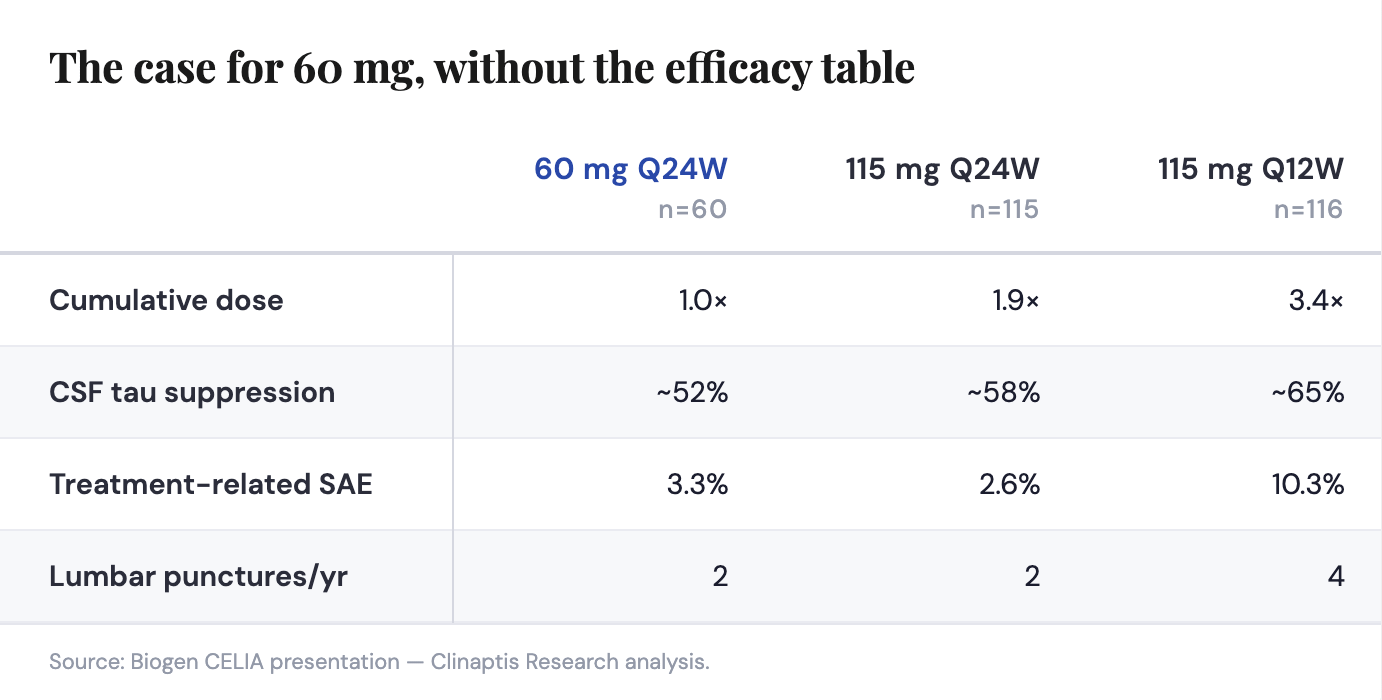
Two independent variables point the same way — the biomarker curve and the dosing schedule — and both land on 60 mg whether or not the clinical ranking means anything. Biogen anchored on the noisiest efficacy estimate in the study instead, reaching for the fragile evidence while the robust evidence sat in the adjacent panel.
The best objection is not efficacy. It is timing — and nobody is making it. Tau PET separated by dose only at week 76; low and mid were identical at week 54, and 115 Q12W’s PET curve is the only one still moving down. If tau imaging leads neurodegeneration by a year or more, that movement is a signal about years three to five, which an 18-month readout structurally cannot see. On that view, 60 mg optimizes for the endpoint the trial could measure rather than the one the disease will deliver. But Ph2 cannot distinguish that hypothesis from the simpler one — saturation. CELIA cannot adjudicate the trade. The extension can.
That leaves one residual uncertainty. The 60 mg arm enrolled the fewest ApoE4 homozygotes, the fastest decliners in the disease, at 16.7% versus 20.9% in placebo, 23.5% at 115 mg Q24W and 26.7% at 115 mg Q12W. The ordering mirrors the efficacy gradient exactly. It is also specific to homozygotes: on total carrier burden the 60 mg arm is the heaviest, not the lightest (70.0% versus placebo’s 66.1%, with the most heterozygotes of any arm at 53.3%).
Biogen’s disclosed CDR-SB MMRM adjusts for baseline severity but not ApoE4, the best-characterized predictor of subsequent decline. Well specified for baseline severity; silent on slope.
Could ApoE4 explain the 60 mg result? No. A 4.2-point homozygote imbalance is directionally consistent with the observed ordering but far too small to manufacture it. The narrower point is that it weakens confidence in reading the 60 mg estimate literally, and with only ten homozygotes in that arm no subgroup analysis can size its contribution. Which is the 2:1:2:2 allocation’s own verdict: the arm carrying the trial’s headline is the arm least able to defend it.
Both objections attack the estimate, not the dose. Neither touches the biomarker curve, the SAE step, or the puncture count — which is why 60 mg survives them.
VI. The 3.5× problem
The drug probably works. The dose is defensible. The Pbo-adj. effect size is unknown — and only the last one is priced.
What survives is the trajectory: 0.00 at week 24, 0.18 at week 48, 0.54 at week 76, still accelerating at last observation. Noise inflates a magnitude; it does not manufacture a shape. With no ARIA and twice-yearly dosing, this is a real asset.
The Ph3 arithmetic is where this becomes a number, and it is the answer to the only objection that matters — why care whether the true effect is 0.29 or 0.54 if the biology is real? Because Ph3 is powered on effect size, not on biological plausibility. Sample size scales as 1/δ², and the calculation contains nothing else: (0.54 / 0.29)² = 3.47. Powering on the defensible estimate rather than the best arm requires ~3.5× more patients. Power on 0.54 when the truth is 0.29 and the trial is not marginally underpowered — it is underpowered by a factor no interim adaptation recovers cheaply, for an intrathecal drug requiring lumbar punctures.
The population compounds it. Every CELIA patient was anti-amyloid naive, so Phase 3 must choose between a clean readout in an increasingly unrepresentative population and a relevant one carrying an untested amyloid–tau interaction. Neither is free, and enrollment feasibility, not science, may decide it.
Biogen’s silence is what makes the implication specific. On what happens next the company has said only: “Ongoing analyses of the data expected to be presented at key upcoming medical congresses and in the literature. Continued engagement with the medical community and regulators on Phase 3 trial planning.” No dose. No sample size. No population. No timing. After an 8.8% drawdown, that is not an oversight. It is the whole disclosure.
So the next repricing event is not further debate over a Ph2 point estimate. It is the Phase 3 design: dose, powering assumption, sample size, population and — given a benefit still accelerating at week 76 — duration. Those slides reveal what Biogen actually believes the effect size is, a belief so far expressed only through a 26% headline it demoted to an appositive. The market has repriced the mechanism’s ambiguity at −8.8%. It has not repriced a 3.5× trial, because it does not yet know whether it is getting one.
Bottom line
The market fell 8.8% on the right instinct and the wrong reason. It is not that the low dose won — nothing won. It is that consensus has anchored on the one estimate in the study least able to bear the weight, and Phase 3 will be sized on it.
CELIA validated tau as a target. It did not validate a dose, an effect size, or a Phase 3 design. 60 mg is probably still right — on saturating biomarker returns, fourfold better tolerability, two lumbar punctures a year rather than four. None of those is the reason Biogen gave. Phase 3 will be sized on the evidence, not on the decision.
What this note assumes — and hasn’t proven
Two things the deck settles: the error bars are ±SE by Biogen’s own axis label, and the clinical MMRM’s covariate list is disclosed and omits ApoE4. What remains open:
Digitisation precision. Our extraction reproduces Biogen’s 0.54 exactly and implies an SD (2.27) within 3% of CLARITY AD’s (2.33). The point estimates are solid; the SEs carry more error, and every p-value inherits it. A model-derived SE 25% tighter than the plotted one would move the headline to nominal significance. Unlikely. Not excluded.
Both corrections need the dose-response to be genuinely absent, not merely undetected — and CELIA cannot distinguish those. Pooling assumes it outright; the winner’s curse assumes it too, plus comparable arm SEs (0.366 / 0.304 / 0.303 — close, not identical). The methods are less independent than their machinery suggests, and if a real dose-response sits below the noise floor, both fail together.
ApoE4 is a plausible confound, not a demonstrated one. With ten homozygotes at 60 mg, that is where the analysis stops.
The lecanemab comparison is structural, not evaluative. It compares the shape of two clinical trajectories across trials differing in stage, population and duration. It supports a claim about rate — not a ranking of two drugs.
ADAS-Cog13 and MMSE cannot be reconstructed from disclosed data. Biogen led with them. We do not claim to know why.
Our view moved twice getting here. Pre-AAIC we expected a biomarker plateau — wrong; both markers are monotonic. On first reading the arm data we proposed a therapeutic window — also wrong; the confidence intervals dissolve it. What replaced both is simpler and less satisfying: saturating biology, and clinical noise. We publish the corrections because a framework that only reports its wins isn’t a framework.
Disclaimer
This publication has been prepared by Clinaptis Research, the research publication of Clinaptis Advisors, for informational and educational purposes only. It does not constitute investment advice, investment research, an offer or solicitation to buy or sell any security, or a recommendation regarding any investment strategy or financial instrument. The views expressed are those of the author as of the publication date and may change without notice.
Clinaptis Advisors is not a registered investment adviser, broker-dealer, or licensed financial professional. Readers should conduct their own independent due diligence and consult qualified financial, legal, tax, and other professional advisers before making any investment decision. Investing in publicly traded securities involves risk, including the possible loss of principal.
Unless otherwise stated, factual information is derived from publicly available sources, including company filings, earnings calls, regulatory documents, clinical trial registries, scientific publications, and other materials believed to be reliable. While reasonable care has been taken in preparing this publication, no representation or warranty, express or implied, is made regarding the accuracy, completeness, or timeliness of the information presented. Estimates, projections, scenario analyses, valuation models, statistical reconstructions, and other forward-looking statements reflect the author’s independent analytical judgment and are inherently uncertain.
Copyright © Clinaptis Advisors. All rights reserved. This publication, including its analytical frameworks, methodologies, valuation models, graphics, figures, tables, visualizations, written content, and other original research, is the intellectual property of Clinaptis Advisors and may not be reproduced, redistributed, republished, or incorporated into derivative works without prior written permission, except for brief quotations with appropriate attribution.