
Celldex: A Positive CSU Readout May Not Be Enough
The p-value looks de-risked. Valuation hinges on whether complete response (CR) looks more like remibrutinib (~28–31%) or clears Xolair’s historical ~34–44% range.

1. Variant view — an unusual setup
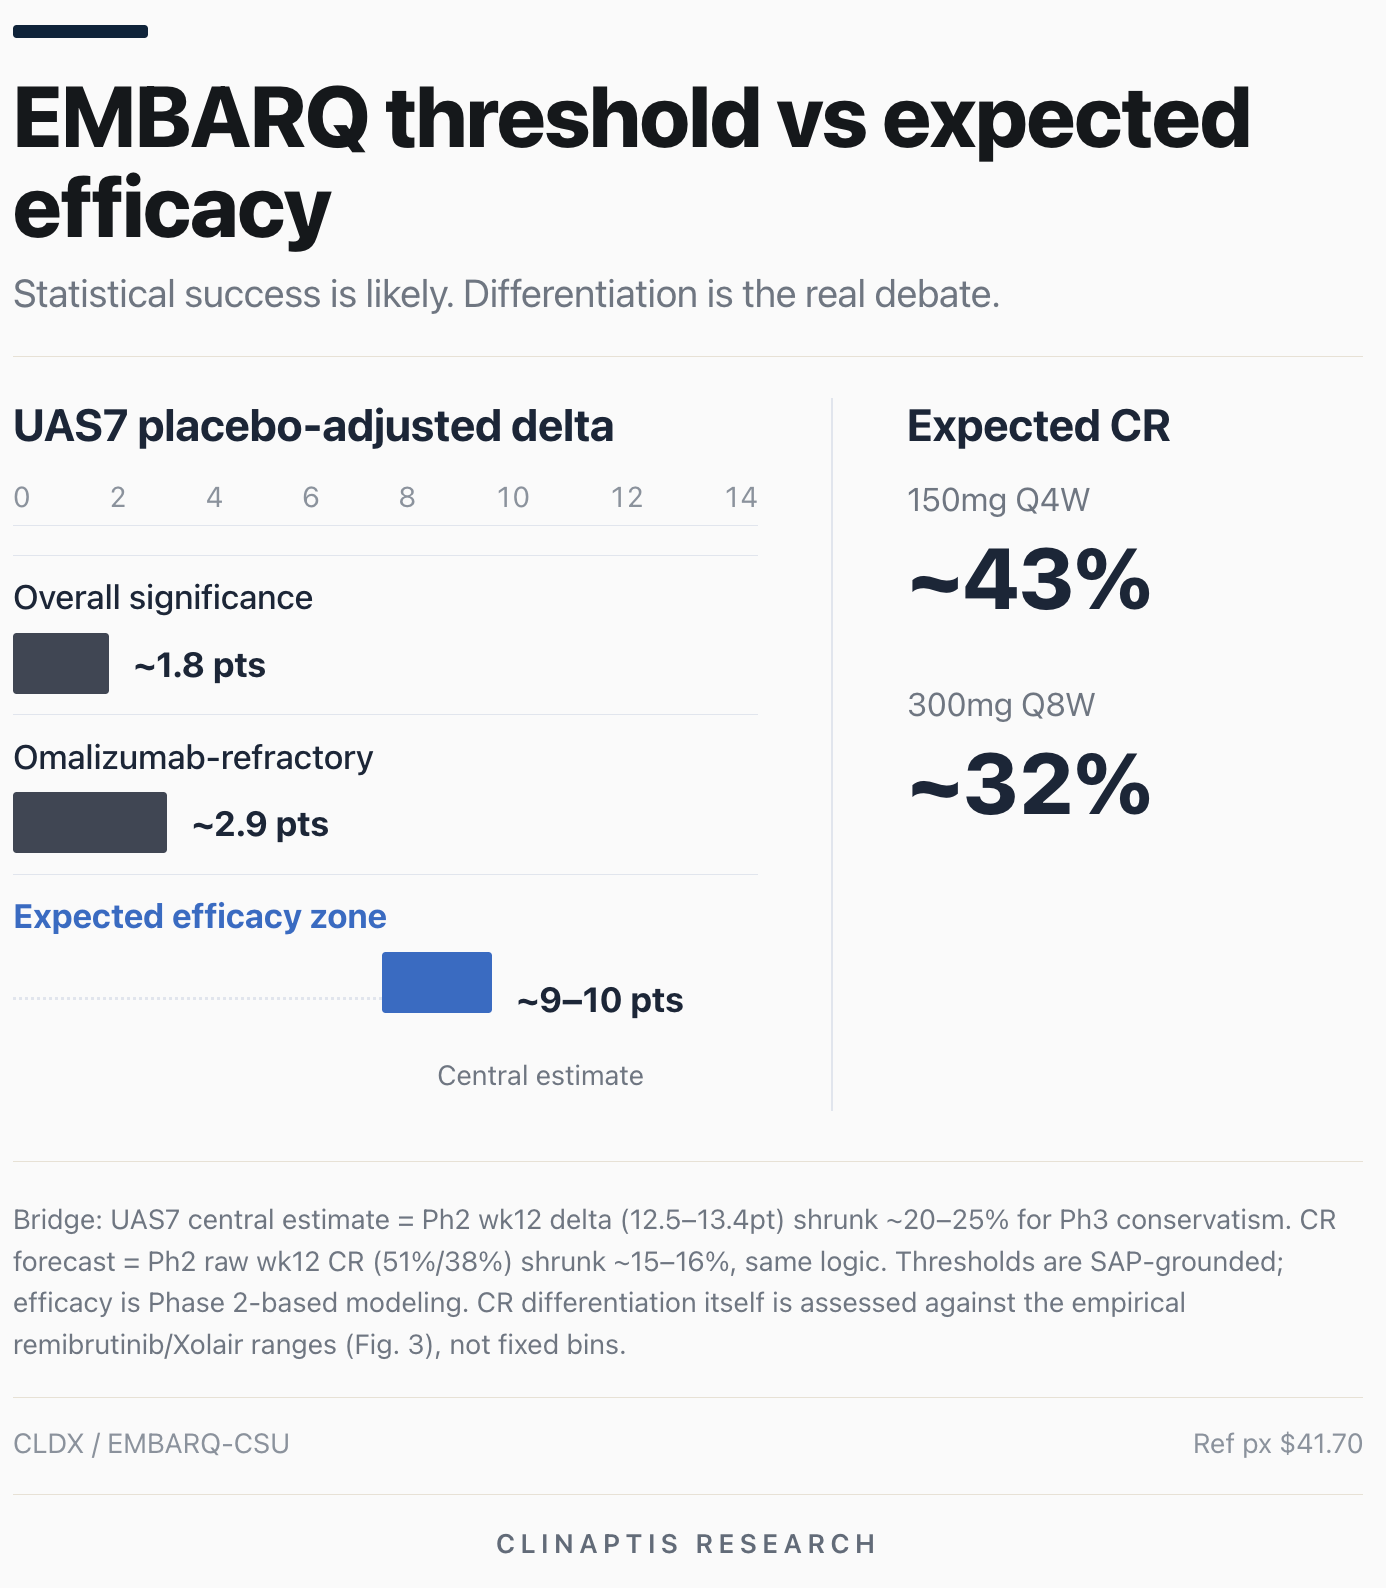
The setup. Celldex is heading into Phase 3 EMBARQ-CSU readouts with an unusual setup: the pivotal efficacy hurdle looks relatively easy to clear, but the stock can still disappoint on a statistically positive readout. The Phase 3 significance bar is only ~1.8 UAS7 points versus placebo, and our central estimate is closer to 9–10 points. Outright efficacy failure is not our central concern. What matters is whether barzolvolimab produces enough complete responses — particularly in omalizumab-refractory patients — to look genuinely differentiated from remibrutinib and Xolair, without KIT-related safety friction eroding that advantage. Our unconditional approval PoS is 70%, below the ~85–90% a clean double-hit would eventually earn — two replicate trials, a binding refractory-subgroup hurdle, and unresolved KIT safety keep it there.
Valuation. Our Base SOTP is $39.28/sh, roughly 6% below the $41.70 reference price — Base itself implies modest downside, not just the catalyst layer. The joint-outcome framework prices what happens across eight possible combinations of the two trials’ results, and assigns a 16% probability that at least one trial misses the primary endpoint outright — a probability we’ve tempered down from 22.1%, the figure our underlying concordance model produces mechanically, to reflect more conviction that both trials clear the primary (full explanation in §3). On that basis, the eight joint two-trial states value CLDX at $38.72/sh, roughly 7% below the reference price — now close to Base rather than materially below it. Differentiated/BIC efficacy supports ~49–70% upside; discordant or partial-failure outcomes carry roughly 34–39% downside; an outright miss remains a ~64% downside event.
CSU is not one input among several — it is the valuation. Of our $39.28/sh Base SOTP, roughly $21.9/sh (~56%) comes from the CSU program alone. The rest of the pipeline — ColdU/SD, AD, and CDX-622 combined — contributes only ~$8.8/sh (~$726mm rNPV), and net cash adds another ~$8.7/sh ($717.6mm). That concentration is why EMBARQ-CSU, not the broader pipeline, is effectively the entire investment case into this catalyst.
At $41.70, the market’s implied CSU peak sales (~$1.85B) are essentially in line with our own modeled CSU peak (~$1.83B) — spot isn’t pricing meaningful upside or downside to our central case.
The three numbers. For the readout itself, three numbers matter most: the overall UAS7 delta needs to clear ~1.8 points; the omalizumab-refractory subgroup carries a higher ~2.9-point hurdle; and complete-response (CR) rates need to land near our Phase 2-based modeling — ~43% for 150mg Q4W, ~32% for 300mg Q8W. Both CR figures are Ph2 observed rates shrunk ~16% for Phase 2→3 conservatism, consistent with the ~20–25% shrinkage applied to the UAS7 estimate; the full bridge is in §4.
Stock call. At $41.70, we would not own CLDX outright into Sep/oct Ph3 EMBARQ-CSU readouts. The primary UAS7 endpoint is relatively de-risked, and a clean positive readout could push the stock above $50/sh — roughly our bullish-base case. But spot already sits above our Base value, while probability-weighted value is $38.72 and partial-failure states carry ~35–40% downside.
The real upside requires clear CR differentiation, particularly in omalizumab-refractory patients, where our differentiated/BIC cases support ~49–70% upside. We would rather wait for a better entry or use a defined-risk structure.
2. Two layers of uncertainty
We use the $39.28 Base to value CLDX today and the $38.72 joint tree to underwrite the catalyst. They answer different questions and should not be added together.
Base (Bear/Base/Bull: $14.51 / $39.28 / $76.20) is a point-estimate view of fair value today, each case carrying its own unconditional approval PoS (60% / 70% / 88%). The eight-state joint tree (§3) instead prices what the two Phase 3 trials jointly show, conditional on a readout: the four clean-hit states carry a uniform 95% residual PoS, the three friction states an incremental 85–92% discount for state-specific regulatory risk. J2, the closest analog to Base, is labeled “on-plan differentiation” rather than Base to keep the two figures visually distinct.
Applying Base’s PoS to the scenario tree would double-count risk already priced into the tree’s probability weights — that’s the whole reason to keep the two layers separate.
3. Joint two-trial scenario tree
The important risk is not simply that both trials fail. A discordant readout or refractory-gate failure can impair value despite an otherwise positive headline. We assign these outcomes 23.1% combined probability (J5+J6). Combined with a tempered 16% primary-failure probability (J8, down from a concordance-implied 22.1%, reflecting more conviction that both trials clear the primary), catalyst-weighted value comes to $38.72/sh — modestly below Base rather than materially below it.
Per-trial outcome buckets (Strong 55% / Modest 30% / Miss 15%) come from the SAP hurdle against our central efficacy estimate, tempered by the tighter refractory hurdle. A 75% concordance assumption — both trials landing in the same bucket — generates the joint distribution below; the “both convincing” branch is split further by differentiation tier (BIC / on-plan / volume-led) in the same relative proportions used previously.
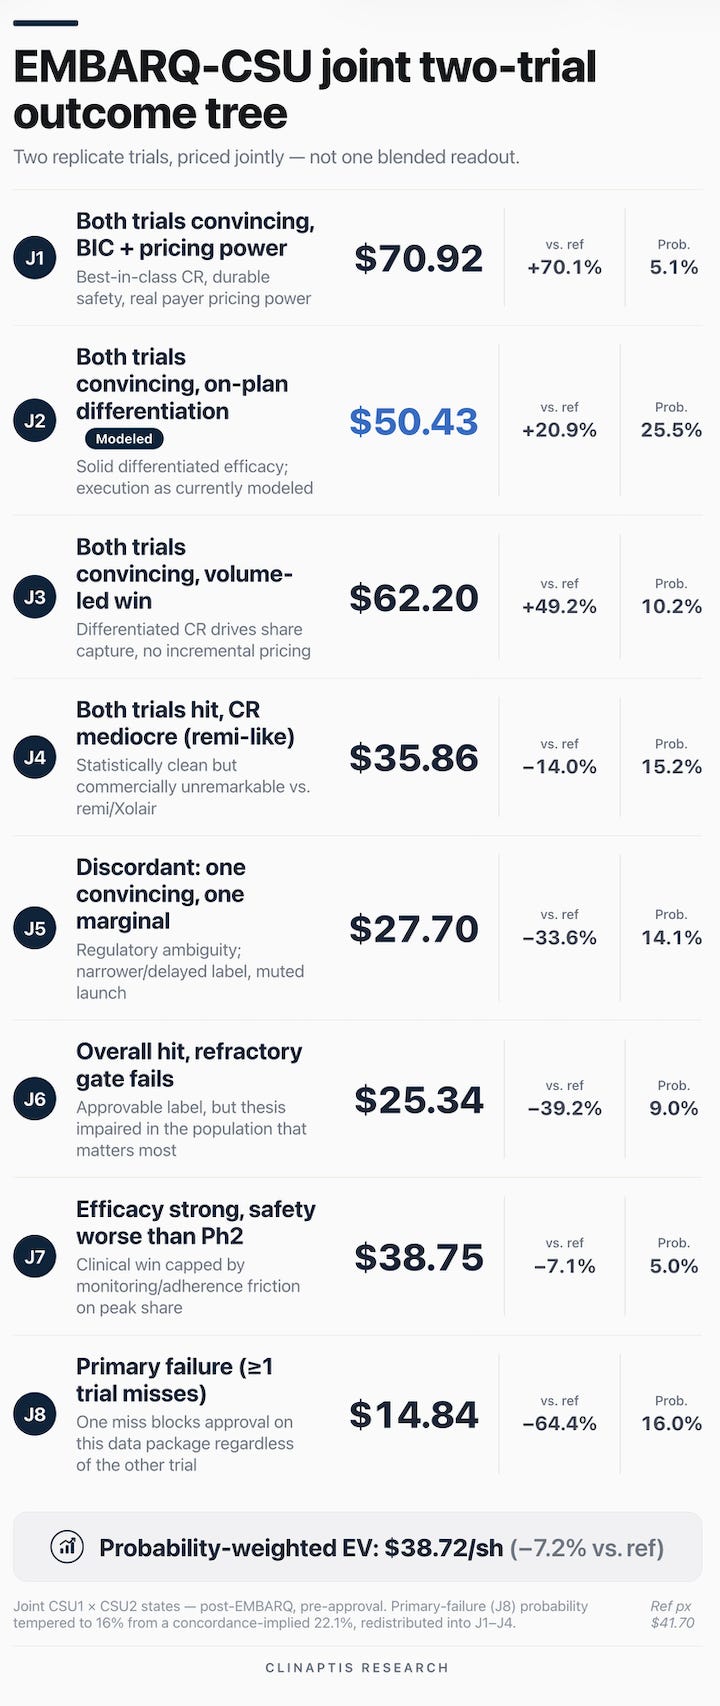
Result: $38.72/sh (−7.2% vs. spot), against a Base of $39.28/sh — the two layers now sit close together. J5 (discordant, 14.1%) and J6 (refractory-gate failure, 9.0%) are the largest remaining components of the gap; outcomes a simple pass/fail framing would otherwise miss.
How sensitive is this to the primary-failure probability assumption?
Not very.
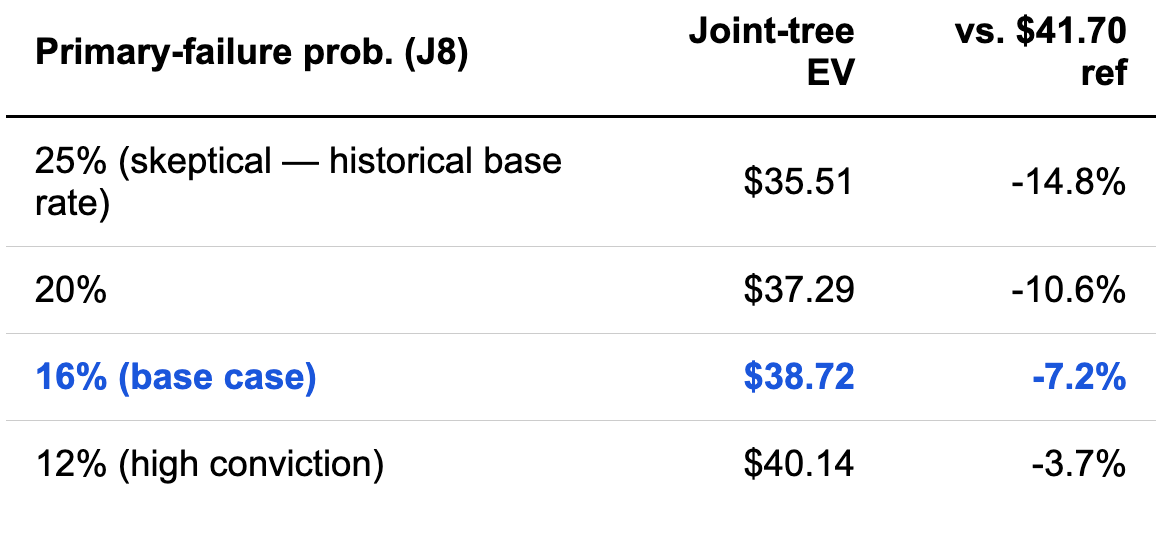
At a more skeptical 25% — closer to historical Ph3 replicate-trial base rates — EV falls to $35.51 (−14.8% vs. ref). At a high-conviction 12%, EV rises to $40.14 (−3.7% vs. ref). The base case ($38.72, −7.2%) sits roughly in the middle of that range, not at an extreme. The direction holds — joint-tree EV stays below spot across all but the most optimistic end — but the magnitude of downside is genuinely sensitive to how much conviction you put in both trials clearing the primary.
Double-counted risk?
The $39.28 Base and $38.72 joint-tree values are alternative lenses on overlapping replication risk, not additive downside cases — and now sit close enough to serve as a rough cross-check on each other. Base compresses approval risk into a single 70% PoS; the tree decomposes that risk across specific readout states, including the tempered 16% primary-failure probability. For the catalyst, I still put more weight on the latter.
4. What would count as differentiation
Our own CR forecasts are less differentiated than the Phase 2 headline suggests. At week 12, the 150mg forecast (43%) clearly exceeds remibrutinib’s range but sits inside Xolair’s; the 300mg forecast (32%) sits within remibrutinib’s range and just below Xolair’s floor.
Remibrutinib sets the lower anchor and Xolair the upper one. Remibrutinib’s REMIX-1/REMIX-2 trials (NEJM 2024, primary source) put week-12 CR in the high-20s to low-30s, comfortably ahead of placebo. Xolair’s three pivotal 300mg trials — ASTERIA I, ASTERIA II, and GLACIAL — span the low-to-mid-30s into the mid-40s: a real range across three separately-run trials, not a single number.
Barzolvolimab’s own week-12 Ph2 data (EADV 2024, primary source) came in well above both anchors. Our Ph3 forecast, shown below, shrinks those raw rates ~16% for Phase 2→3 conservatism — the same haircut applied to the UAS7 delta forecast in §1.
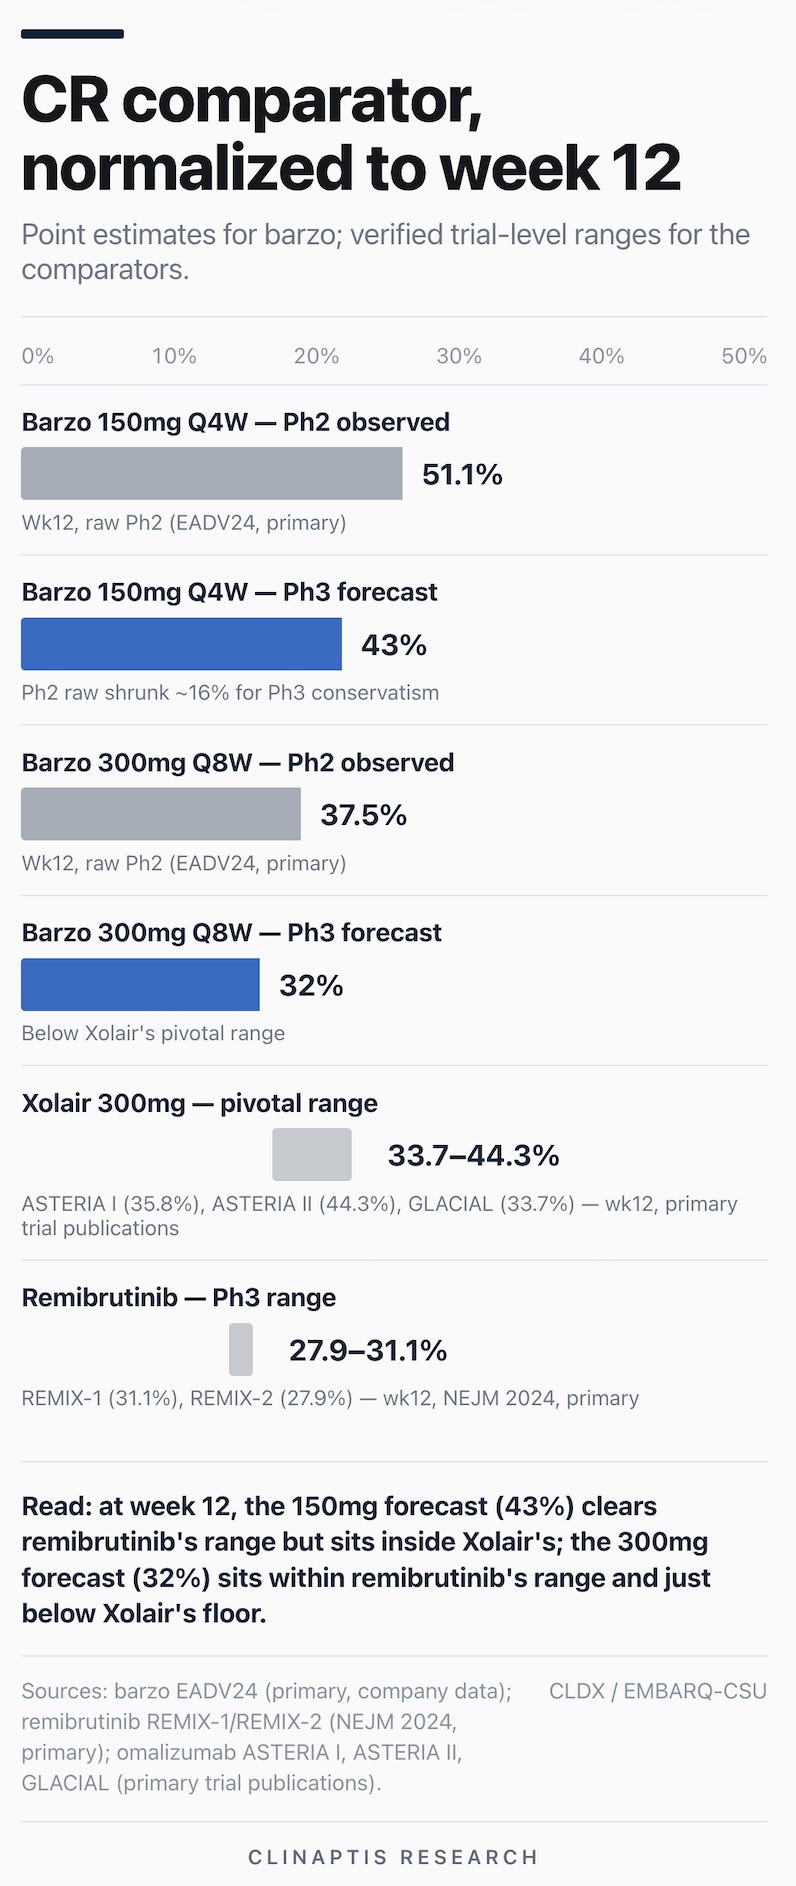
A genuinely best-in-class print therefore likely requires CR materially above the low-40s, not simply a result that clears any single comparator number.
5. Positioning
Short interest: 7.63M shares (9.71% of shares out., 11.53% of float) as of 7/31/26, down modestly from 6/30/26; days-to-cover 7.54. A slow-covering short base amplifies both tails without changing which outcome is more likely.
Sell-side coverage generally sits above our framework — we read that as the market not yet pricing the catalyst’s genuine bimodality, not as a signal we’re wrong.
Expression: the skew favors a defined-risk structure — a call spread around the differentiated-win zone, or a long paired with downside protection sized to the failure tail — over a naked long.
6. A clean efficacy win may not mean a clean label
Barzo’s efficacy advantage comes with a mechanism-specific commercial trade-off: KIT depletion also produces neutropenia and pigmentation changes that Xolair and remibrutinib largely avoid.
Neutropenia: 9% at 16 weeks (placebo-controlled), 17% by 52 weeks (placebo 0%) — on-target, since KIT supports normal myelopoiesis. If this incidence results in a routine CBC monitoring requirement — not yet established — that adds friction the other two drugs avoid.
Hair color change / hypopigmentation: 14%→26% (hair), 1%→13% (hypopigmentation) from 16 to 52 weeks — also on-target, and plausibly the more commercially consequential AE given its visibility. Cosmetic AEs are a documented driver of discontinuation elsewhere in dermatology, but the chain from AE to discontinuation to share loss has evidence only for its first link in barzolvolimab specifically.
Longer exposure produces more cumulative events; whether the underlying hazard rises, and how severe these events are, remains unknown pre-CTCAE data. The only hard safety number is the SAE rate: 1% (n=2/156) through 52 weeks. Comparator detail: Appendix A.
7. Post-print monitorables
What would invalidate differentiation on topline
CR landing around the remibrutinib range (~28–31%) rather than approaching/exceeding the upper end of Xolair (~44%), even with the primary comfortably significant.
Omalizumab-refractory subgroup missing its ~2.9-point bar while the overall primary hits (the J6 trigger).
Placebo response trending toward the high end of the historical comparator range.
Ph3-scale neutropenia/hypopigmentation worse than Ph2 (the J7 trigger).
What matters after topline
Ph2→Ph3 discontinuation-rate delta.
Omlyclo/biosimilar Xolair pricing trajectory.
Real-world remibrutinib net pricing and uptake.
CTCAE-grade safety supplement and pigmentation-reversibility kinetics, if disclosed.
Franchise-level read-throughs
Any safety signal update from ColdU/SD or AD (same molecule/target) — informative for CSU risk even though it’s a different program.
None of the above changes the base call before data. But a print inside the differentiated/BIC zone with a clean refractory subgroup would move me from the sidelines to a long; a discordant or refractory-gate outcome would confirm staying out was right. The asymmetry, not the base case, is the trade.
Appendix A — Mechanism and comparator detail
c-KIT AE mechanism (expanded from §6): barzolvolimab depletes mast cells via KIT receptor engagement. KIT signaling also supports normal myelopoiesis (hence neutropenia) and melanocyte survival/function (hence hair color change and hypopigmentation) — both AEs are on-target consequences of the mechanism, not off-target toxicity, which is mechanistically reassuring in one sense (predictable, dose/exposure-related) and concerning in another (not easily engineered away without giving up the efficacy mechanism).
Safety comparator table
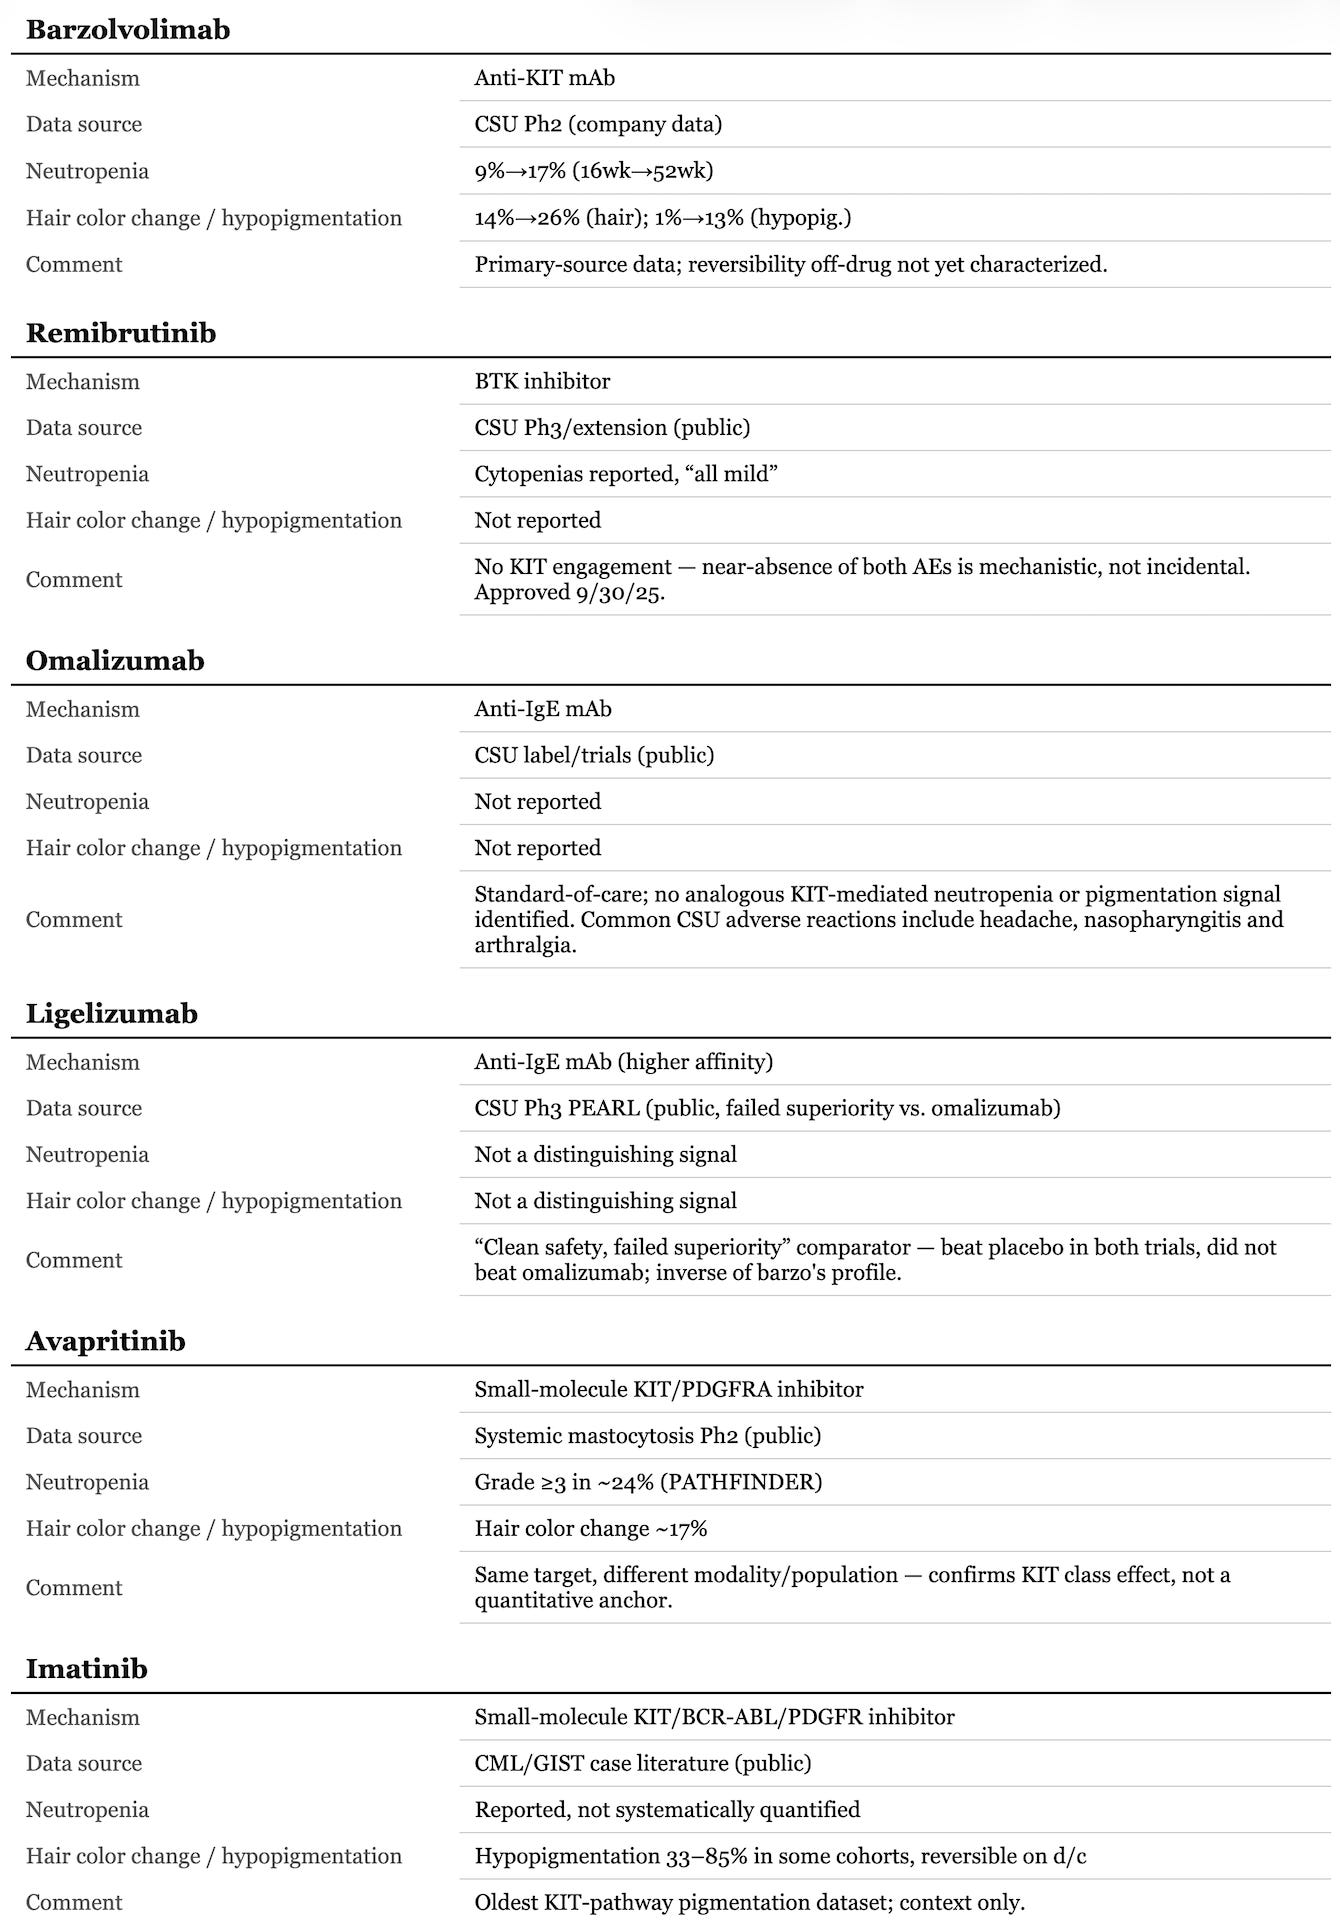
Sourcing: barzo data from the company’s own Ph2 EADV disclosure (primary). Comparative framing for Xolair (no analogous KIT-mediated neutropenia/pigmentation signal) and ligelizumab (failed superiority vs. omalizumab, not failed efficacy) is confirmed against primary trial publications and labels. Underlying AE incidence figures for remibrutinib, omalizumab, ligelizumab, avapritinib, and imatinib are still drawn from public trial reports and safety summaries via web search, 8/13/26 — not independently checked against primary FDA labels or full CSRs. Directionally reliable; verify before citing in a context requiring primary-source-grade sourcing.
Appendix B — Valuation methodology and open limitations
Base case build: SOTP rNPV. CSU DCF (diagnosed pool 1.04M, epi-triangulated; 55% peak advanced-therapy penetration of the eligible pool; 10% Barzo peak share of treated pool; $45,000 net price/patient-year; 70% unconditional approval PoS) plus risked option value for ColdU/SD, AD, and CDX-622, plus net cash.
Open limitations, carried forward from prior review and not yet resolved:
ColdU/SD peak-sales and pricing assumptions rest on a directional judgment trim, not a rigorous bottom-up epi/pricing workstream comparable to the CSU build. A dedicated ColdU/SD workstream remains banked.
The eight-state joint-tree probabilities (concordance parameter and per-trial Strong/Modest/Miss split) are house judgment calibrated to the SAP hurdle and Ph2 data, not literature-derived or formally simulated. The primary-failure probability (J8) is further tempered from the concordance-implied 22.1% to 16%, a manual overlay reflecting higher conviction that both trials clear the primary — redistributed proportionally into the four clean-hit states, not re-derived from the underlying concordance model. A future revision could replace this with a Ph2-posterior Monte Carlo simulation; this revision uses a transparent, documented heuristic instead.
Comparator safety data for remibrutinib, omalizumab, ligelizumab, avapritinib, and imatinib draw partly on public/secondary sources not independently verified against primary labels or CSRs (flagged inline in the Appendix A table). CR comparator figures (Fig. 3) are verified against primary trial publications.
PoS discounts applied to the discordant/friction states (J5–J7: 85%/90%/92%) are directional judgment calls about regulatory friction, not derived from FDA precedent base rates for similar discordant-trial packages.
Disclaimer:
This report is independent research published by Clinaptis Research and reflects the author’s own analysis and opinions as of the publication date. It is provided for informational purposes only and does not constitute investment advice, a recommendation, or an offer or solicitation to buy or sell any security. Clinaptis Research is not a registered investment adviser or broker-dealer. The analysis relies on public disclosures, third-party data and reasonable estimates where noted; Clinaptis Research believes these sources to be reliable but does not guarantee their accuracy or completeness. Estimates, scenarios and forward-looking statements are inherently uncertain and actual results may differ materially. The author and related parties may hold, or may in the future hold, a position in the securities discussed. This report may not be reproduced or redistributed without permission.