
IONS Drew First Blood. SHASTA-3/4 Is Arrowhead’s Turn
Tryngolza’s approval changes the question ahead of SHASTA-3/4. The Street will focus on headline TG reduction; we think the real readout is threshold crossing below 500 mg/dL.

Tryngolza Approved for sHTG: The Category Benchmark Is Now on the Label
Tryngolza (olezarsen) just became the first drug approved with an acute pancreatitis risk reduction label in sHTG. The market will fixate on 85% AP reduction and 72% TG lowering. It will likely miss the number that matters most.
When Arrowhead’s (ARWR) SHASTA-3/4 reads out in 3Q26, analysts will score it on TG% reduction versus CORE. That is a proxy metric. What determines AP outcomes is the proportion of patients who cross below the 500 mg/dL threshold — not the headline TG reduction percentage. A drug cutting TG by 80% from a baseline of 2,000 mg/dL moves fewer patients below that threshold than one cutting 70% from 900 mg/dL. Same class, same mechanism, dramatically different therapeutic profile.
We built a proprietary threshold-crossing model — calibrated to the Pedersen epidemiological dataset, benchmarked against three independent APOC3 trial datasets, and anchored to ARWR mgmt’s own 1Q26 population comparability commentary — to project what SHASTA-3/4 should deliver and what constitutes a genuine clinical win.
Olezarsen CORE/CORE2 studies enrolled ~1,100 patients specifically to power the AP secondary — and delivered: 85% AP reduction, 86% threshold crossing, NNT = 20 overall and NNT = 4 in the TG ≥880 + prior AP subgroup. IONS cut WAC 93% to ~$40K ahead of the sHTG launch — undercutting ARWR’s REDEMPLO at ~$60K and locking in formulary positioning before SHASTA reads out. ARWR enters roughly one year behind on the regulatory timeline, into a market IONS is actively building, with a quarterly dosing profile and a cleaner safety label.
TG Threshold Crossing, Not TG Reduction Percentage, Drives AP Outcomes
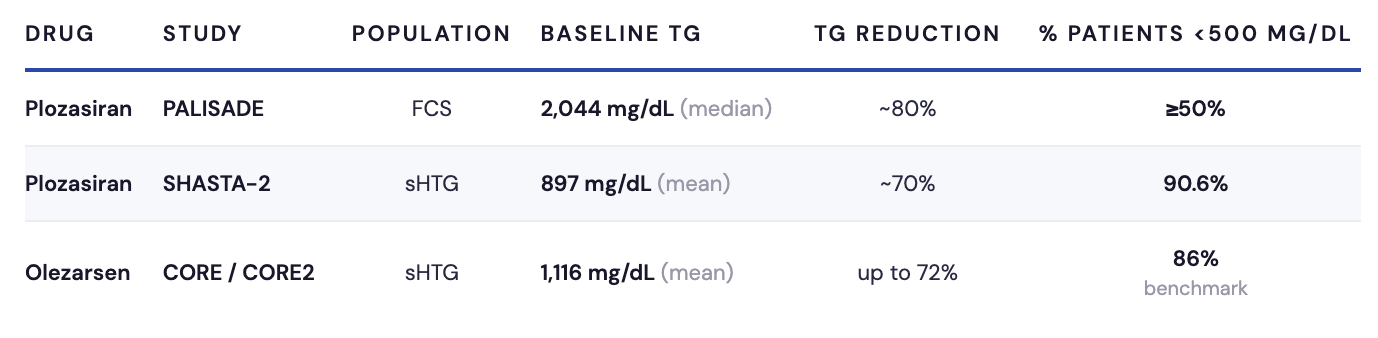
Consider what PALISADE — plozasiran’s Ph3 in familial chylomicronemia syndrome (FCS) — actually showed. At baseline, the median TG was 2,044 mg/dL. Plozasiran delivered ~80% TG reduction and >90% APOC3 suppression. Despite that, only ≥50% of patients achieved TG <500 mg/dL. Now compare SHASTA-2, plozasiran’s Ph2 in sHTG: baseline mean TG of 897 mg/dL, ~70% TG reduction, 90.6% of patients below 500 mg/dL. The same drug, deeper TG lowering in PALISADE, yet dramatically fewer patients crossing the threshold that matters clinically. The entire difference is baseline disease severity.
A larger TG reduction does not necessarily produce more threshold crossing. That observation — drawn from plozasiran’s own clinical program — is the analytical foundation of everything that follows.
The TG→AP relationship is nonlinear, and the nonlinearity clusters around the 500 mg/dL threshold.
Pedersen et al. (2016), a Danish registry study of ~100K patients, mapped AP incidence across TG strata from ~88 to >885 mg/dL. AP incidence rose from 2.7 to 12.0 events per 10,000 patient-years across that range. A power-law model fits those data points at R² = 0.88; a log-linear model fits at R² = 0.73. The relationship steepens at high TG levels, which means the 500 mg/dL threshold is a genuine clinical inflection point — not an arbitrary regulatory line. Critically, APOC3 was not selected empirically. Human genetic studies via Mendelian randomization predicted that APOC3 lowering would reduce both TG and pancreatitis risk prior to clinical testing — establishing a causal chain, not merely an association. That prediction has now been reproduced across three independent molecules.
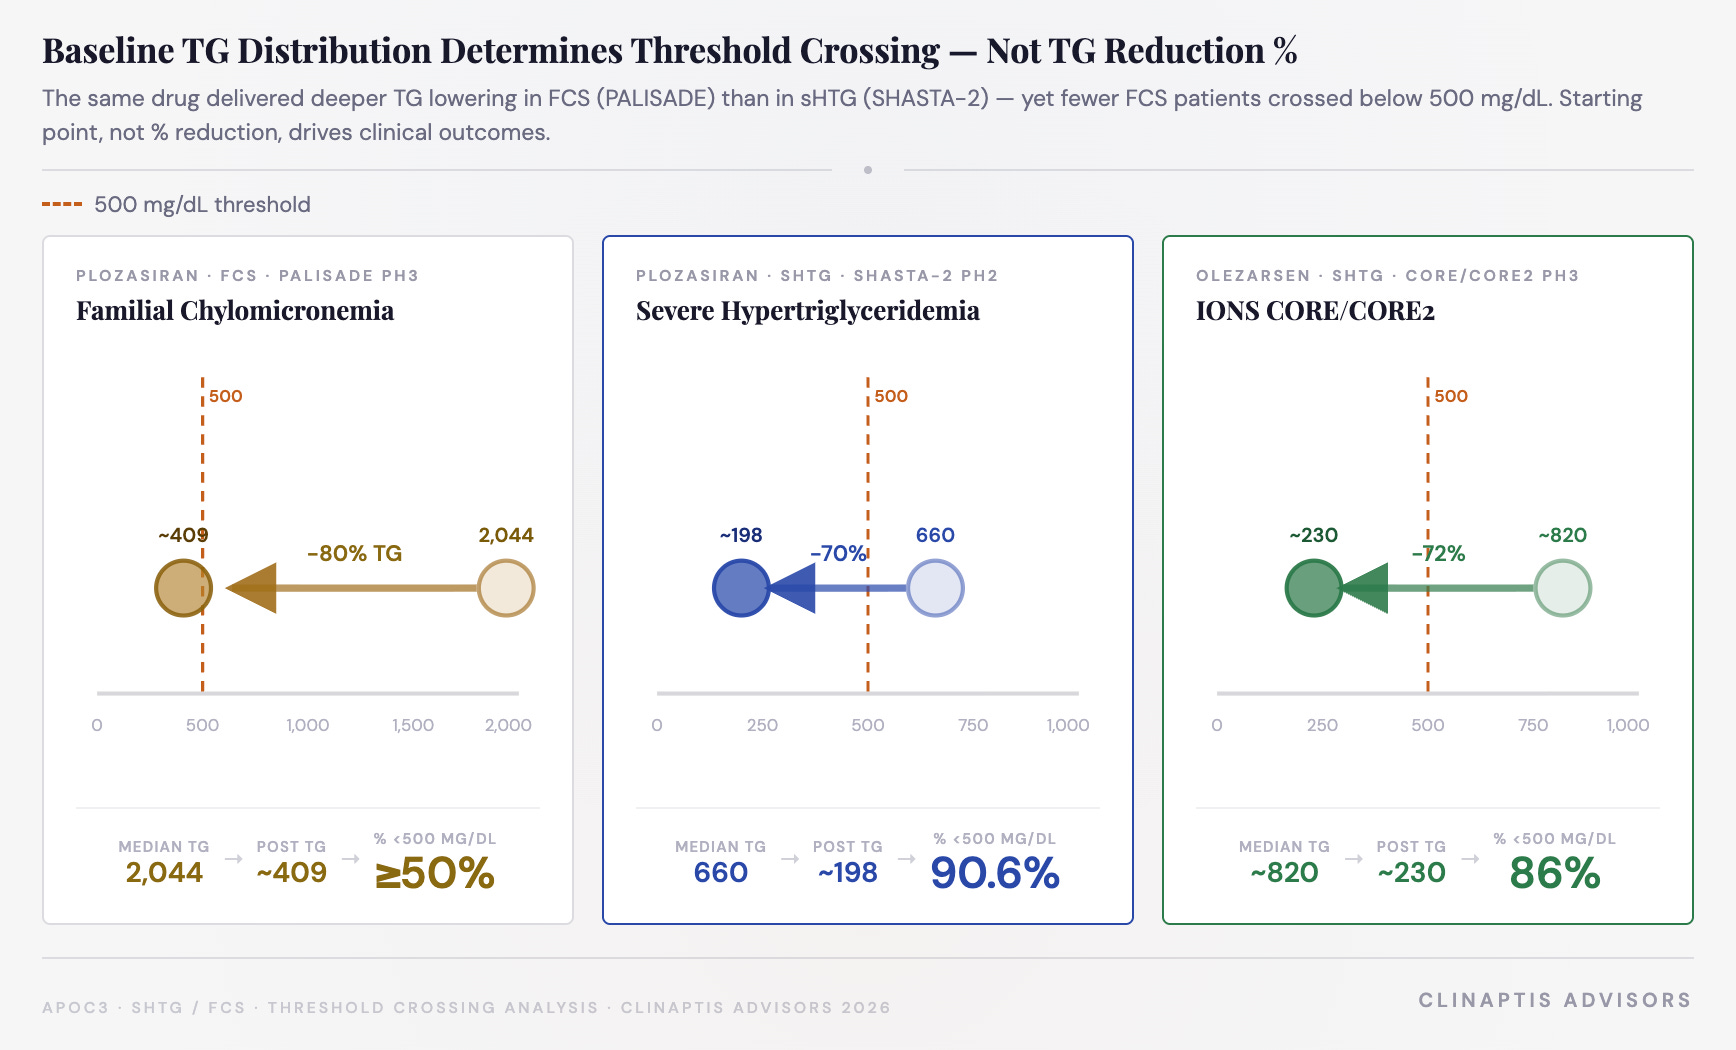
As Visual 1 shows, the same drug produced dramatically different threshold crossing outcomes across populations — not because of TG reduction magnitude, but because of where patients started. PALISADE’s ~80% TG reduction from median 2,044 mg/dL left half the population above 500. SHASTA-2’s ~70% reduction from median 660 mg/dL moved 90.6% below it.
The Model: What Plozasiran’s Efficacy Profile Actually Implies
What we’re projecting
Two outputs drive the investment thesis here. First: the % of SHASTA-3/4 patients likely to cross below 500 mg/dL, benchmarked against CORE’s 86% threshold crossing. Second: the implied AP risk reduction that follows, benchmarked against CORE’s 85% AP reduction.
The input: assumed TG reduction
Best anchor is SHASTA-2’s 25mg arm — 70.2% absolute TG reduction at Week 24 (LS mean, n=55, SE ±5.5pp). Ph3 trials typically show modest attenuation from Ph2, so a realistic range is ~65–70% (base case is 70%), with upside to ~76%.
From TG reduction to threshold crossing and AP outcomes
We fit a log-normal distribution to the SHASTA-3/4 pooled baseline (mean 966, median 742 mg/dL) and applied the TG reduction range. The % crossing below 500 mg/dL follows from the standard normal CDF. The Pedersen power-law (AP = 0.138 × TG^0.630, R² = 0.88) then translates that threshold crossing into an implied AP risk reduction. ARWR management confirmed on the 1Q26 call that it is “rational to look at CORE/CORE2” placebo rates as a comparator given population similarity — directly validating CORE as the empirical anchor.
Monte Carlo simulation: what are the probabilities?
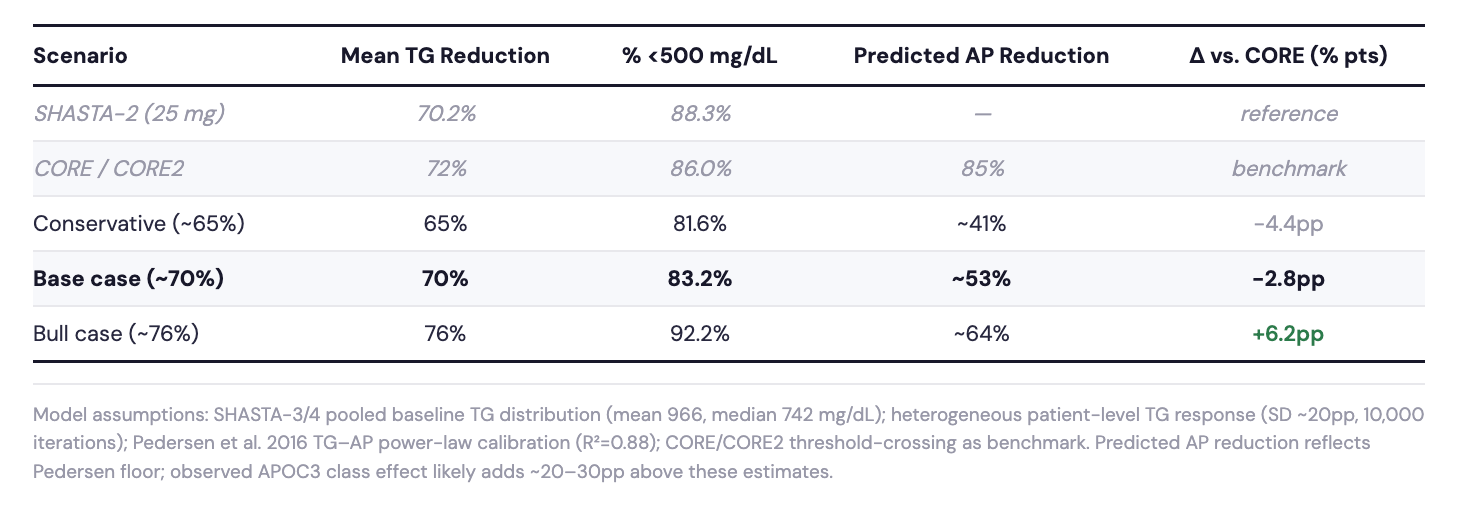
Our base case projects ~83% of SHASTA-3/4 patients crossing below the clinically relevant 500 mg/dL triglyceride threshold, approximately 3 percentage points below the 86% observed in CORE/CORE2. Rather than relying on a single point estimate, we modeled the full distribution of potential Phase III outcomes using a 10,000-iteration Monte Carlo simulation incorporating heterogeneous patient response (patient-level SD ~20 percentage points). Acute pancreatitis reduction was estimated using the Pedersen power-law relationship and should be viewed as a TG-mediated floor estimate, before any additional APOC3 class effect.
The simulation assigns a) 61.9% probability of exceeding 50% placebo-adjusted TG reduction; b) 35.0% probability of matching the ~55% placebo-adjusted reduction achieved in CORE/CORE2; and c) a 13.9% probability of exceeding 60% placebo-adjusted TG reduction. Taken together, the model suggests SHASTA-3/4 is more likely to produce clinically meaningful triglyceride lowering than to fully replicate the efficacy observed in CORE.
The downside scenario emerges if placebo-adjusted TG reduction attenuates toward ~65%, where threshold crossing falls to approximately 82%. Although SHASTA-3/4 enrolled patients with a lower mean baseline triglyceride level than CORE (966 vs. 1,116 mg/dL), that advantage is offset by our assumption of slightly lower efficacy (~70% vs. 72% TG reduction), producing an expected threshold-crossing rate approximately 3 percentage points below CORE.

Why the model consistently underpredicts — and what that means
The Pedersen floor estimates TG-mediated AP reduction from general population epidemiology; CORE provides the empirical benchmark for what APOC3 inhibition actually delivers in a similar Ph3 population. Across three independent datasets, the Pedersen floor undershot observed AP reduction by 20–30pp every time. PALISADE ~60%, volanesorsen pool ~82%, CORE/CORE2 ~85% — against a base case prediction of ~53%. AP reduction barely moved despite TG lowering ranging from ~70% to ~80% across programs. Volanesorsen, olezarsen, and plozasiran — two ASO modalities and one siRNA — all converged on ~80–85%. That is a class effect, not molecule-specific activity.
AP risk reduction = TG effect (Pedersen floor) + threshold crossing effect + APOC3 class biology (~20–30pp above the epidemiological baseline).
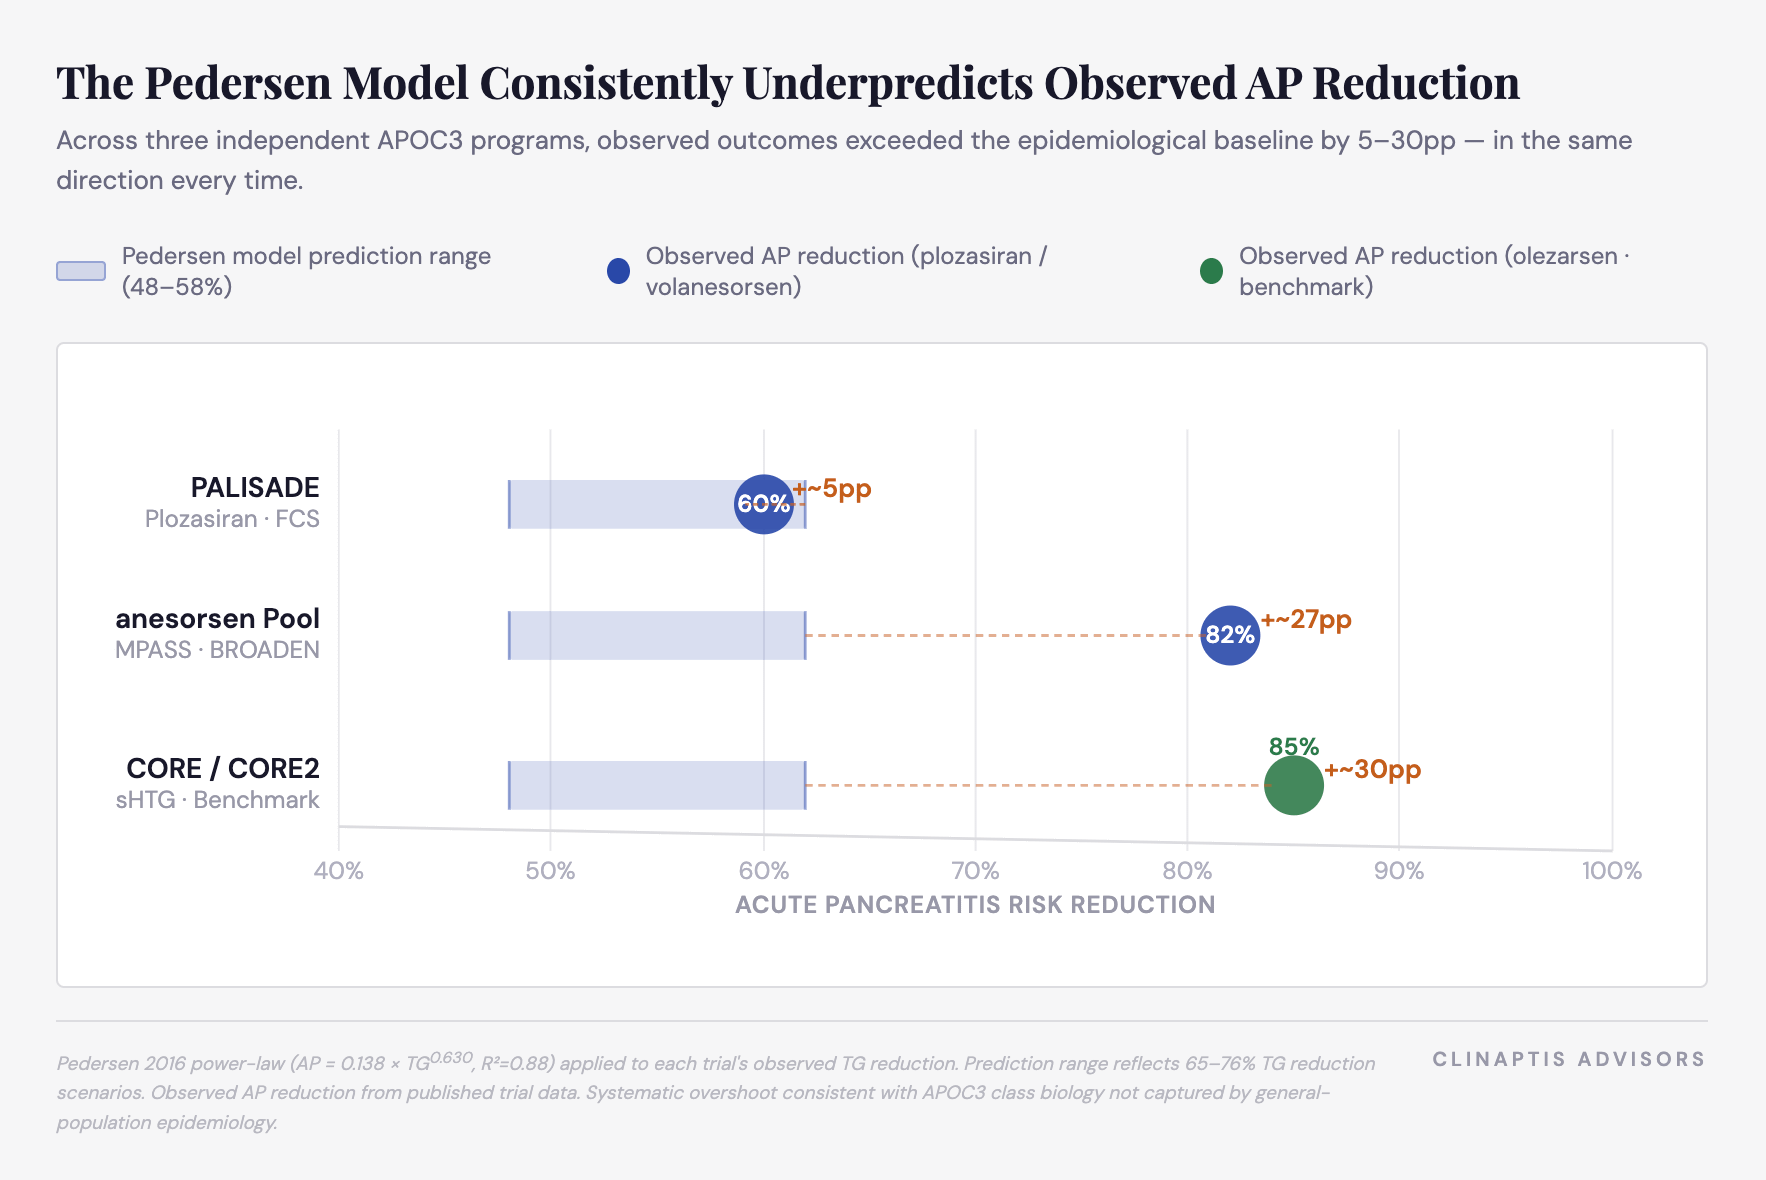
Pedersen Model visual above underscores this point: the shaded prediction range sits at 48–58% across all three programs. Observed outcomes land at 60%, 82%, and 85%. The systematic overshoot is not noise — it is the class effect. For SHASTA-3/4, this means the Pedersen floor (~41–64%) is the conservative bound, not the base case.
Prior AP history matters at the individual patient level — it amplifies AP benefit when threshold crossing occurs — but it does not explain trial-level outperformance. CORE and SHASTA populations both carry ~20% prior AP history, identical to each other and far below PALISADE’s 88–92%.
CORE vs. SHASTA-3/4: The Benchmark Comparison
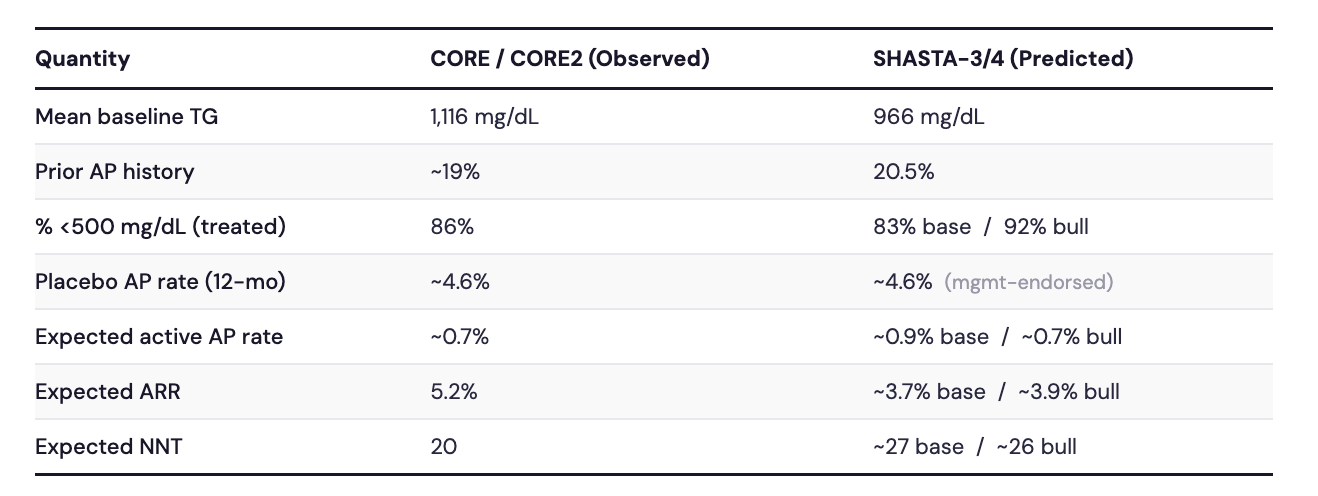
Placebo AP rate from CORE/CORE2 KM curve (pooled). Active AP rate derived by applying model-predicted RRR to CORE placebo benchmark.
The model’s base case puts SHASTA-3/4 ~3pp short of CORE’s threshold crossing benchmark — achievable under the bull case, not guaranteed under base. The APOC3 class effect means observed AP reduction is likely to exceed the Pedersen floor. Whether it reaches CORE’s 85% depends on the high-risk subgroup data.
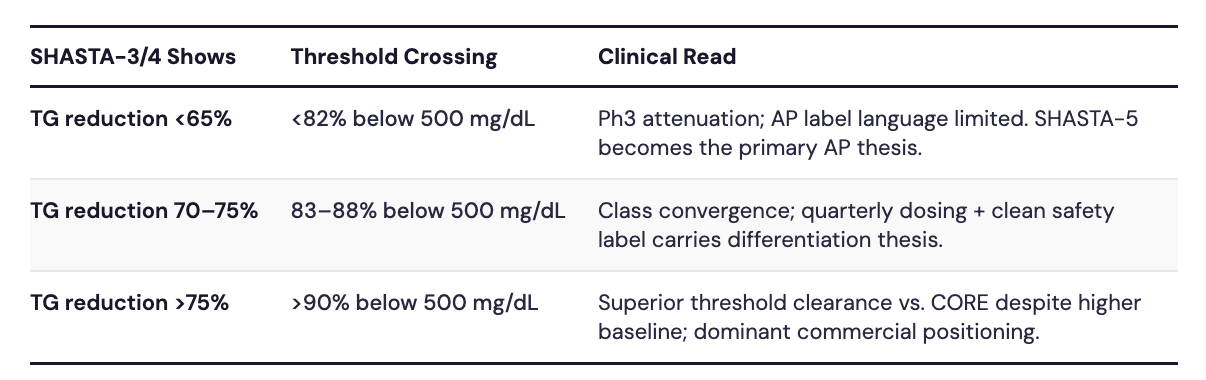
What SHASTA-3/4 Needs to Show — 3Q26 Readout Guide
IONS has set a high bar. Tryngolza’s Ph3 package delivered 72% TG reduction, 86% of patients below the 500 mg/dL pancreatitis threshold, and 85% AP reduction — translating to NNT = 20 across the broad sHTG population and NNT = 4 in the highest-risk subgroup. That NNT = 4 is the clinical number that matters most: treating four patients with TG ≥880 and prior AP history for one year prevents one acute pancreatitis episode. That is not a marginal benefit in a disease where each episode carries ~$30–50K in hospitalization costs and real mortality risk.
In our view, TG threshold crossing — % of patients achieving TG <500 mg/dL — is systematically underappreciated as the operative efficacy metric. TG reduction percentage is the headline; threshold crossing is what determines AP outcomes. The distinction matters at readout.
sHTG TAM. ARWR mgmt framed the initial core market at 750K–1M high-risk patients — those with TG ≥880 or prior pancreatitis — not the broader 3–4M patients with TG >500. We remain cautious on IONS’s >$3B combined peak sales guidance for sHTG specifically: the sHTG population is larger, more heterogeneous, and carries lower average disease severity than FCS. Commercial ramp will be gradual, access-dependent, and heavily front-loaded toward the high-risk subgroup where the clinical and economic case is clearest. That said, the unmet need is real, the category is now validated, and ARWR enters with a differentiated dosing profile. The readout is 3Q26. Here is how to read it.
Threshold crossing — the prespecified secondary that matters most. % of patients achieving TG <500 mg/dL is a prespecified secondary endpoint in SHASTA-3/4. Our base case projects ~83%, ~3pp short of CORE’s 86% benchmark but within normal Ph2→Ph3 attenuation range. If it comes in at 76% (conservative), approvability on the primary TG endpoint is not threatened — the primary TG endpoint is almost certainly cleared — but the AP benefit case weakens and label language on pancreatitis risk reduction weakens with it. If it exceeds 88% (bull), plozasiran has a credible clinical argument despite starting from a higher baseline TG than CORE.
AP event data — directional, not definitive. SHASTA-3/4 is not powered for AP as a primary endpoint. ~700 patients (2:1, ~467 treated) vs. CORE/CORE2’s ~1,100 limits statistical precision. AP events are captured as adjudicated secondaries using modified Atlanta criteria — now accepted by FDA, EMA, and payers. Applying CORE’s observed placebo AP rate (~4.6%) and RR (0.15) to SHASTA-3/4’s enrollment implies ~14 total expected events — sufficient for ~80% power at 9 events, ~90% power at 12. ARWR mgmt. noted on the 1Q26 call they are pleased with the blinded AP event rate and are not extending SHASTA — directionally positive, though blinded event comfort does not confirm treatment effect. If AP data are reported, the question is whether plozasiran lands near the Pedersen floor (~53–64%) or the observed APOC3 class range (~80–85%). Three independent programs across two modalities have already converged on 80–85% — that is a class effect, not molecule-specific activity. Anything materially below it demands explanation. If SHASTA-3/4 AP signal disappoints, SHASTA-5 — a dedicated AP outcomes study broadened to a persistent chylomicronemia + prior pancreatitis population — provides the long-term backstop.
High-risk subgroup — the crucial clinical and commercial divide. The ≥880 mg/dL TG stratification is where the commercial thesis lives. CORE demonstrated NNT = 4 in patients with TG ≥880 and prior AP history — where prescribing is effectively non-discretionary. A comparable plozasiran signal in that cohort makes quarterly siRNA dosing the decisive differentiator over monthly subcutaneous Tryngolza. SHASTA-3/4 enrolled 96% on background lipid-lowering therapy, 63% on ≥2 agents — efficacy is demonstrated on top of aggressive standard of care. The safety profile is ARWR’s cleanest competitive angle: the REDEMPLO 25mg pivotal dose has not generated the platelet, hepatic, or glycemic signals that complicated earlier GalNAc-siRNA programs, and the label carries none of the hypersensitivity warnings, liver enzyme monitoring requirements, or hepatic fat language present on IONS’s Tryngolza. In a disease where patients already carry high metabolic comorbidity burden, a cleaner monitoring profile matters at the prescriber level.
The Setup
Tryngolza’s approval validates the category, establishes reimbursability, and sets $40K as the pricing anchor. Category validation before a Ph3 readout is a cleaner setup for ARWR than launching into an unproven market — but it also raises the bar. Three APOC3 inhibitors across two modalities have converged on ~80–85% AP reduction. SHASTA-3/4 will tell you whether plozasiran sits in that range — and whether quarterly RNAi dosing gives ARWR a genuine formulary argument against monthly Tryngolza or a me-too position in a category in which IONS will have a meaningful lead.
Three numbers matter on readout day: TG % reduction (primary endpoint, almost certainly cleared); % of patients below 500 mg/dL (our preferred efficacy metric, base case 83%); and AP event direction in the TG ≥880 subgroup. Everything else is secondary.
Links: Pedersen 2016 Study
Disclaimer: This note is published by Clinaptis for informational and educational purposes only. Nothing herein constitutes investment advice or a recommendation to buy or sell any security. Clinaptis is not a registered investment advisor or licensed financial professional. All data and market figures referenced are sourced from publicly available information including company filings, earnings transcripts, clinical trial publications, and regulatory disclosures. Where figures are triangulated or estimated, this is noted explicitly in the text. Readers should conduct their own independent research and consult a licensed financial advisor before making any investment decision.
Clinaptis publishes independent market structure commentary on pharmaceutical and biotech categories. All views are the author’s own.