
Structure Therapeutics: Is Aleniglipron Really Best-in-Class?
Aleniglipron's 16.3% WL headline restates to ~10–11pp on the basis FDA now requires — a real edge in. oral GLP-1 class, not an established best-in-class gap.

Consensus has already done the obvious exercise: line up three oral GLP-1s, compare their headline efficacy, and declare a winner. The answer is not hiding inside one more carefully colour-coded bar chart of percentage weight loss from baseline. Those charts are accurate. They are simply not measuring the same thing.
Structure Therapeutics (GPCR) trades at $53.14 per ADS, a ~$2.4bn enterprise value against $1.34bn of net cash. The number anchoring that valuation is 16.3pp placebo-adjusted weight loss at 180mg, reported from phase 2 ACCESS II in March and framed by the company as “the highest efficacy among oral GLP-1RAs and comparable efficacy to injectable GLP-1RAs.” Investors compare it with Lilly’s orforglipron and oral semaglutide (Novo’s Wegovy Pill) and conclude best-in-class efficacy. That efficacy comparison matters.
This note starts one step earlier. Before asking which oral GLP-1 is better, it asks whether those headline efficacy numbers belong on the same chart at all.
We normalize aleniglipron to 10.2 - 11.2pp on a label-comparable basis — still ahead of orforglipron across the range and competitive with oral semaglutide only at its upper end. After digging through the data, we do not see a fatal flaw. The headline overstates the advantage, but the remaining profile is sufficiently credible that we struggle to construct a fundamental short thesis. That WL gap is driven primarily by a statistical convention that changed between aleniglipron’s Ph2 and Ph3, documented in the 23-Oct-2023 amendment to Lilly’s ATTAIN-1 protocol and later reflected in FDA’s draft obesity guidance.
The market is valuing GPCR on an efficacy comparison that was never placed on the same regulatory basis. The remainder of this note rebuilds that comparison before asking what aleniglipron is worth.
Most published brokerage research has focused on the headline efficacy result. This note instead addresses three questions:
Dates the regulatory/estimand change and shows why GPCR cannot avoid it.
Measures the resulting shrinkage inside orforglipron’s own program at matched doses, where the counterfactual is observable.
Decomposes the 16.3pp into dose, duration and selection.
We then price it. We think the market prices GPCR roughly fairly — paying for modestly more peak share than our base case assumes — and is underwriting a differentiation claim the restated data supports only at the top of its range.
Stock Call: We are long GPCR in small size and are not adding here. Our base case is $47.14/ADS versus $53.14 last close, while the bull case reaches $86.33. The gap is largely one commercial assumption — 6% versus 9% peak U.S. branded AOM market share. Most of the remaining 2H26 catalysts refine the clinical profile rather than resolve that commercial question.
Recent trading reflects that uncertainty, with the shares repeatedly oscillating within the mid-$40s to low-$50s as the debate shifts from Phase 2 efficacy toward Phase 3 execution and commercial positioning.
SWITCH is the one exception. It is the only scheduled catalyst that directly informs where a 9% share would come from. Until then, we see little edge adding at today’s price.
I. What Is the Market Actually Paying For?
The 2025 December ACCESS package re-rated GPCR. It paired 11.3pp placebo-adjusted weight loss from the core Ph2b study with higher-dose exploratory data, improved tolerability from a lower starting dose, continued weight loss beyond Week 36 and a clear path into Ph3 registrational study. The stock roughly doubled over the following weeks as investors concluded aleniglipron had become a leading oral GLP-1.
That readout is now judged against two approved oral GLP-1s already establishing real-world commercial profiles. Oral semaglutide launched in the U.S. in January 2026 to what Novo called a “record-breaking start,” reaching more than one million patients within four months, and reported 13.6% total weight loss at Week 64. Orforglipron (marketed as Foundayo) reported 12.4% total weight loss at Week 72 and has begun its commercial launch. Against those, GPCR’s 16.3pp placebo-adjusted Week 44 headline WL appears comfortably best-in-class.
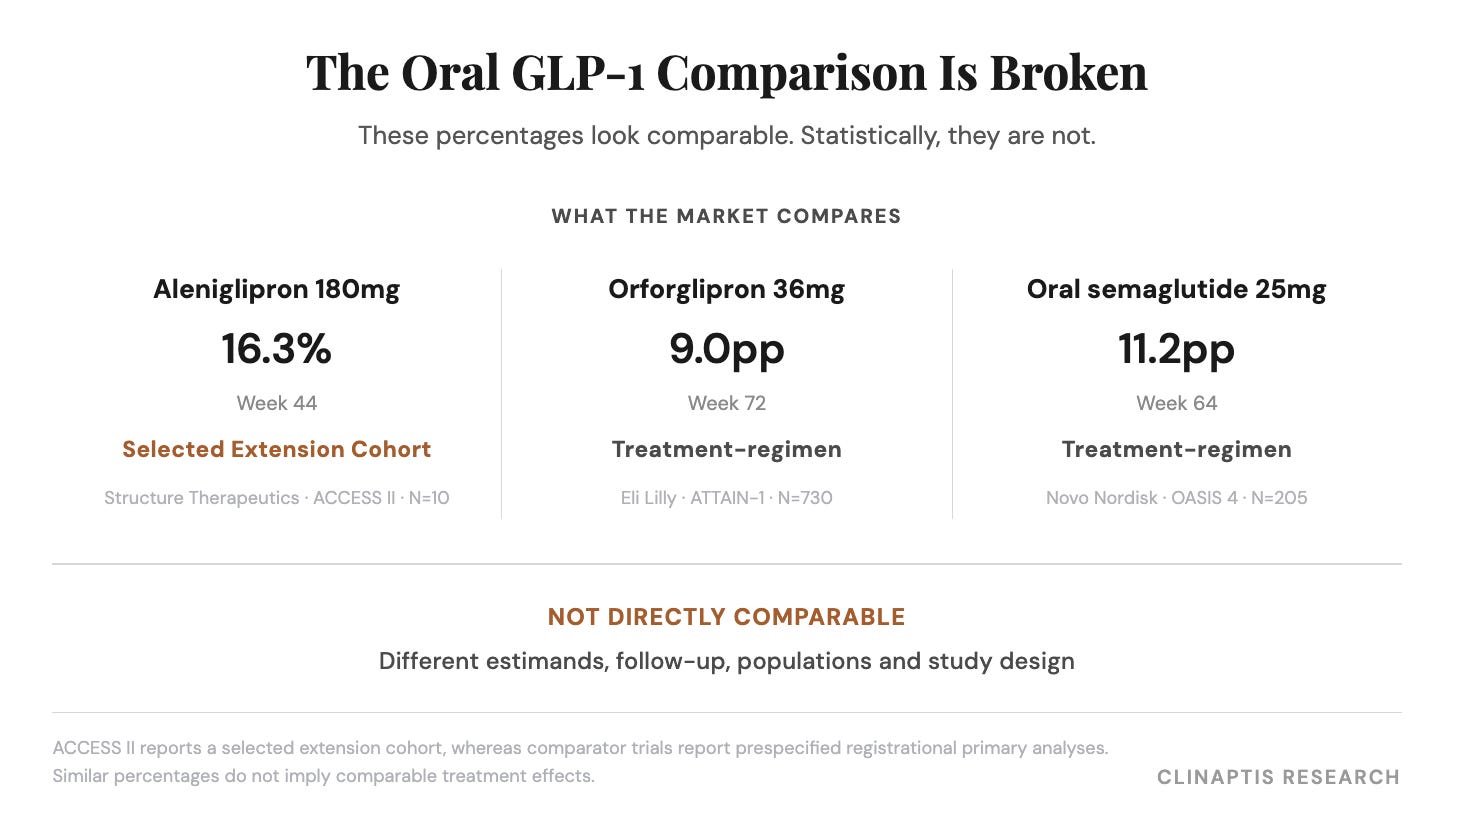
That ranking is incomplete before it starts. The three numbers differ on four separate bases:
Duration — Week 44 vs. Week 72 vs. Week 64.
Estimand — a company-defined convention vs. two disclosed conventions.
Selection — a re-randomised cohort of ten vs. full trial populations of 730 and 205.
Efficacy basis — placebo-adjusted vs. total weight loss.
One correction actually runs in GPCR’s favour, and we flag it because it disciplines the analysis that follows: putting all three assets on a placebo-adjusted basis alone widens aleniglipron’s apparent lead, it doesn’t narrow it. The adjustments that narrow it are estimand and selection — which is why those two carry the note.
Whether that apparent efficacy advantage survives a like-for-like comparison begins with a document GPCR did not write.
II. Why Did Lilly Amend Its Own Primary Estimand Mid-Trial?
Ph3 ATTAIN-1’s protocol is dated 24-Feb-2023. Amendment (c), approved 23-Oct-2023 and flagged substantial, added one sentence:
The treatment regimen estimand will be the primary estimand.
The same amendment deleted the line stating that no multiplicity adjustment was planned between estimands, and moved the primary analysis population from “full participants” to a true ITT set. Stated rationale for all three changes: “Clarification.”
Lilly changed the primary estimand of the largest oral GLP-1 Ph3 obesity study, then running, roughly eight months after enrolment opened and a year before database lock. That is a regulatory ratchet with a date on it — 23-Oct-2023 — and it falls squarely between aleniglipron’s Ph2 and Ph3 programs — the exact transition investors are valuing today.
FDA’s Jan 2025 draft guidance on obesity drug development recommends the treatment-policy estimand as the default primary — every randomized subject measured at each prespecified visit regardless of treatment discontinuation, unless consent is withdrawn — paired with retrieved-dropout multiple imputation and Rubin’s method for continuous endpoints. ATTAIN-1’s October 2023 amendment is consistent with the statistical framework FDA later articulated in that guidance. The guidance remains draft and nonbinding; Lilly’s mid-trial convention simply matches what the Agency has since put in writing as its current thinking.
Why the convention moved is specific to obesity. In an oncology or cardiovascular outcomes trial the endpoint keeps accruing after a patient stops drug — death and myocardial infarction happen regardless. Weight does not. Remove a GLP-1 and appetite returns, so discontinuation (D/C) produces a different outcome rather than a missing one. That distinction becomes consequential at ATTAIN-1’s actual D/C rate: 24.4% at 36mg, with AE-driven D/C at 10.3%, front-loaded into titration.
ACCESS reports under a company-defined Primary Efficacy Estimand. Ph3, designed after the End-of-Phase-2 meeting, is expected to follow the treatment-regimen convention now standard in obesity. Consensus does not price that basis shift. FDA’s draft guidance likewise prioritizes continuous placebo-adjusted weight change over responder thresholds. So do we.
GPCR enters Ph3 after the statistical convention has already changed; investors continue valuing it on a Ph2 number generated before that change.
That leaves the size of it.
III. Measuring the Regulatory Adjustment
The issue is no longer hypothetical. In its review of ATTAIN-1, FDA wrote plainly: “FDA disagrees with the Applicant’s primary analysis results for the primary endpoint.” FDA then replaced Lilly’s analysis with its own preferred approach, noting that “the primary results are generated based on FDA’s preferred approach.” The regulatory conclusion did not change — all three doses remained statistically superior to placebo — but the estimated treatment effect did. That distinction is the foundation of this note.
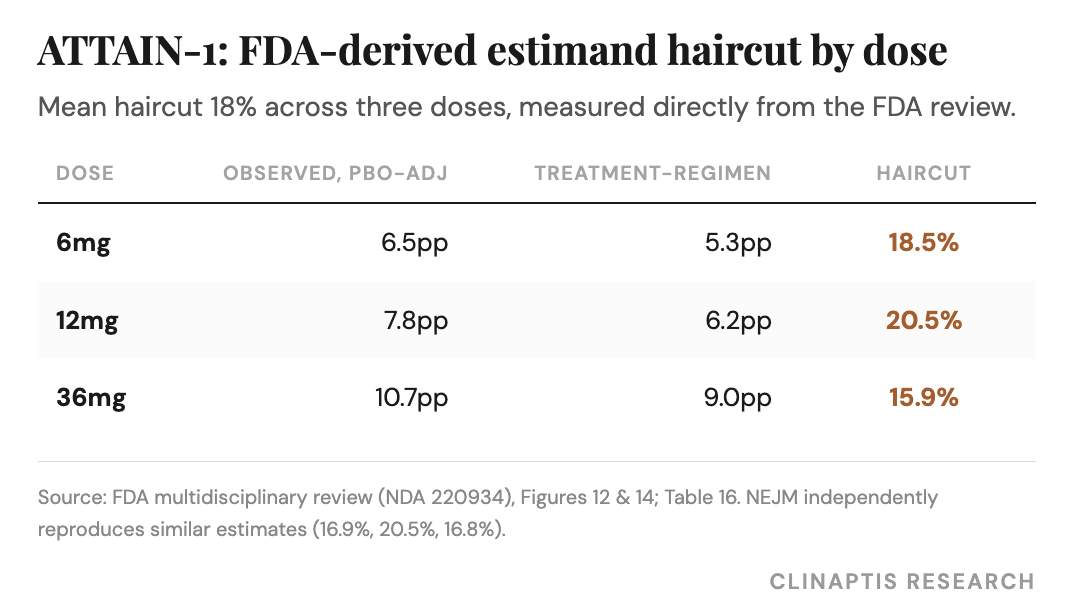
Between 16% and 21% of the placebo-adjusted effect, measured twice from two independent documents.
FDA’s analysis of ATTAIN-1, run directly off the submitted datasets:
Tipping Analysis. FDA also ran two-dimensional tipping-point analyses on this result, deliberately biasing imputed outcomes for missing patients in both directions — better for placebo, worse for orforglipron — to test how far those assumptions could move before superiority broke. Significance held except under extreme penalties: greater than a 15% improvement to placebo’s imputed outcomes, or greater than a 25% penalty to orforglipron’s. FDA’s concluded that the tipping-point results “supported the conclusion based on the primary analysis results.” The magnitude of the effect depends on missing-data methodology; the conclusion of efficacy does not.
The NEJM publication’s treatment-regimen effect sizes — −5.4, −6.2 and −8.9pp — reproduce the band independently at 16.9%, 20.5% and 16.8%. Mean 18%.
ACCESS itself points the same way. In the core Ph2b study, the published treatment-regimen analysis reduced placebo-adjusted efficacy from 8.2pp to 7.9pp (45mg), 9.8pp to 9.2pp (90mg) and 11.3pp to 10.5pp (120mg). That directly demonstrates a 4–7% within-study adjustment. The larger ~18% adjustment is not attributed to the estimand label alone, but to the broader transition from exploratory Ph2 to registrational Ph3, where statistical implementation, missing-data handling and longer follow-up also contribute. ACCESS measures the first step; orforglipron calibrates the complete one. ||
Much of the adjustment arises through the placebo arm. The adjustment on the treated arm alone is 9–12%. It roughly doubles on the placebo-adjusted number because both arms shed patients heavily, for opposite reasons. Placebo discontinued treatment at 29.9% against 21.9 - 24.4% on drug, driven by lack-of-efficacy withdrawal at 6.2% on placebo versus 0.4 - 1.0% on drug. Placebo loses its non-responders; treatment-regimen retrieves their data and pulls the placebo mean toward greater weight loss. The estimand moves both means, in opposite directions.
Differential efficacy dropout is sufficient to create this mechanism, although the magnitude will depend on trial duration, missing-data implementation and discontinuation patterns. ACCESS already exhibits the underlying conditions: 77% of placebo participants failed to achieve even 5% weight loss over 36 weeks.
GPCR’s efficacy is not in question; the estimate is. An 18% adjustment transferred from one molecule to another is still an assumption — the next question is whether it actually predicts anything.
IV. Does the Adjustment Predict Ph3?
Section III derived an 18% adjustment between hypothetical-style and registrational treatment-policy analyses. Section IV asks whether that adjustment survives its first external test. Orforglipron is the only public obesity program that evaluated identical doses in both Ph2 and Ph3.
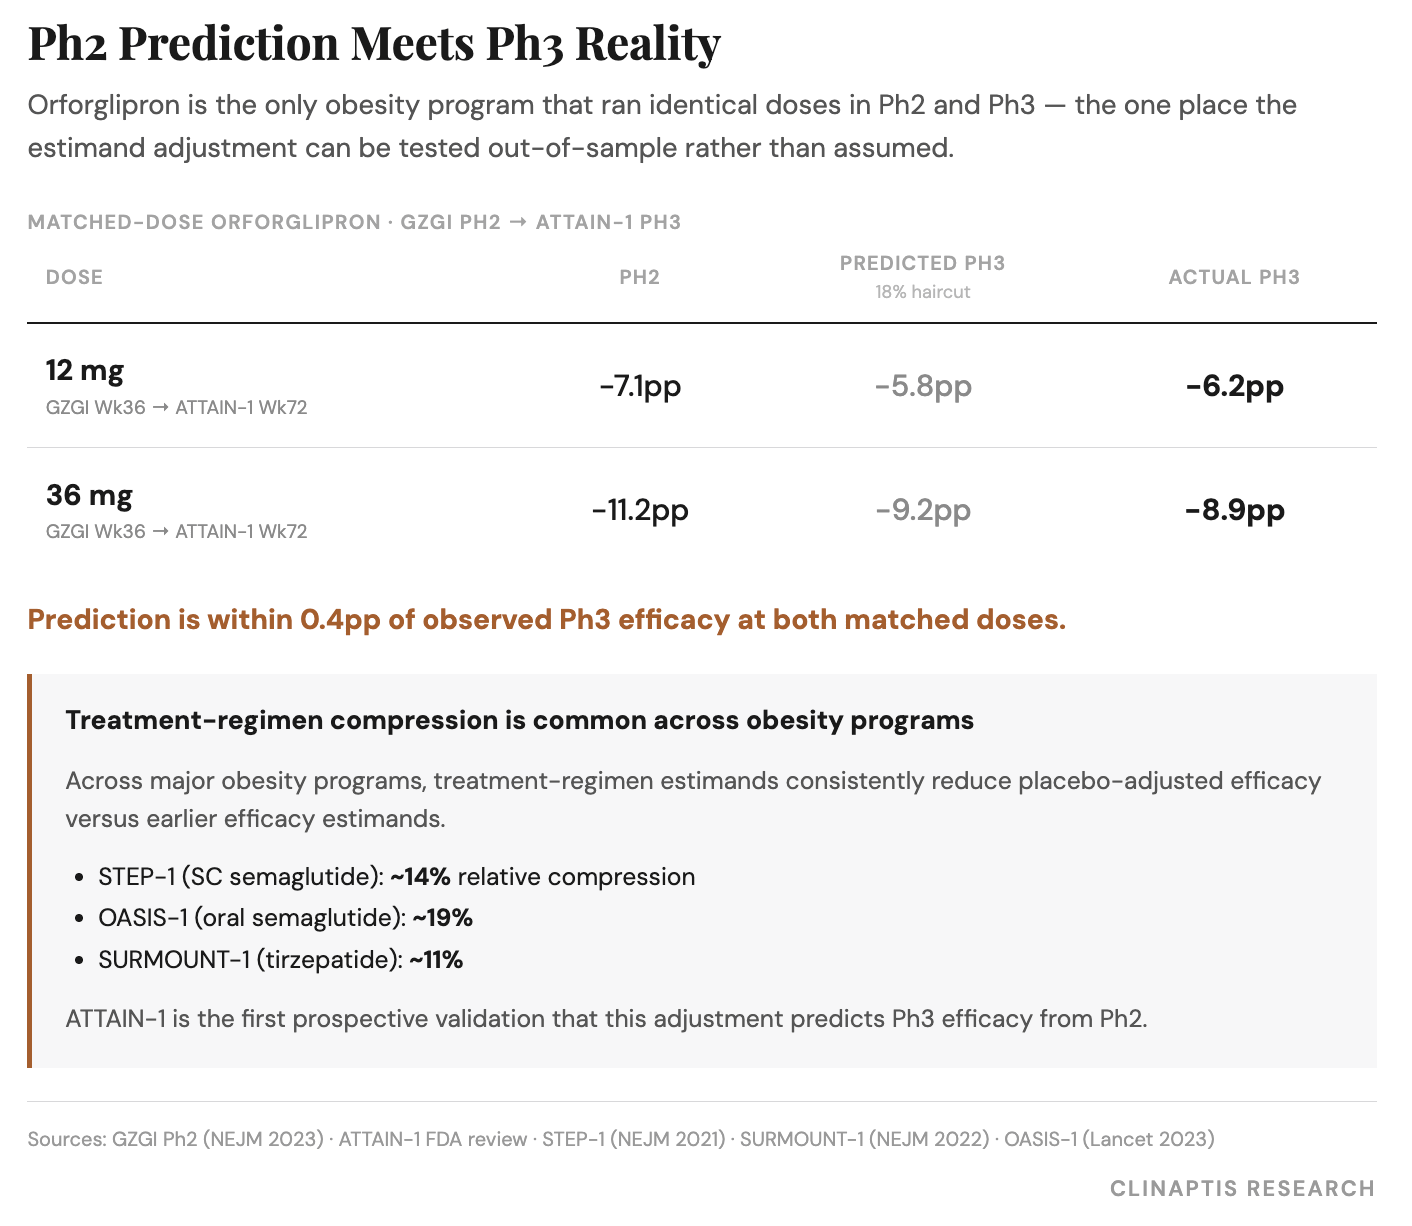
The predictions land within 0.5pp at both matched doses. Overall Ph2-to-Ph3 shrinkage is ~17%; once the estimand adjustment is applied, the unexplained residual falls to ~2% at both doses — effectively noise.
The direction is also consistent across the obesity class. STEP-1, OASIS-1 and SURMOUNT-1 all report lower treatment-policy efficacy than earlier hypothetical-style analyses, with shrinkage ranging from roughly 10–20%. Orforglipron is unique because identical doses permit the adjustment itself — not just the direction — to be tested.
Several features should have made prediction harder, not easier. ATTAIN-1 enrolled an eleven-fold larger and slightly lighter population, slowed dose escalation, permitted protocol-defined dose de-escalation, and maintained patients at target dose for substantially longer. Despite those differences, the prediction remained within 0.5pp at both doses.
Why does this matter? This is the only public obesity program where identical doses of the same molecule were evaluated in both Ph2 and Ph3. It therefore provides the only direct out-of-sample test of the adjustment developed in Section III. The prediction survives at both doses.
The 18% adjustment survives its first external test. The remaining question is what sits inside GPCR’s reported 16.3pp.
V. What Is Inside the 16.3pp WL?
ACCESS II’s 16.3pp headline comes from a post-Week-28 re-randomisation (N=10 at 180mg) of patients who had already tolerated escalation to 120mg. The waterfall below decomposes that number into dose, duration and selection, leaving a 2.0–2.9pp residual attributable to enrichment.
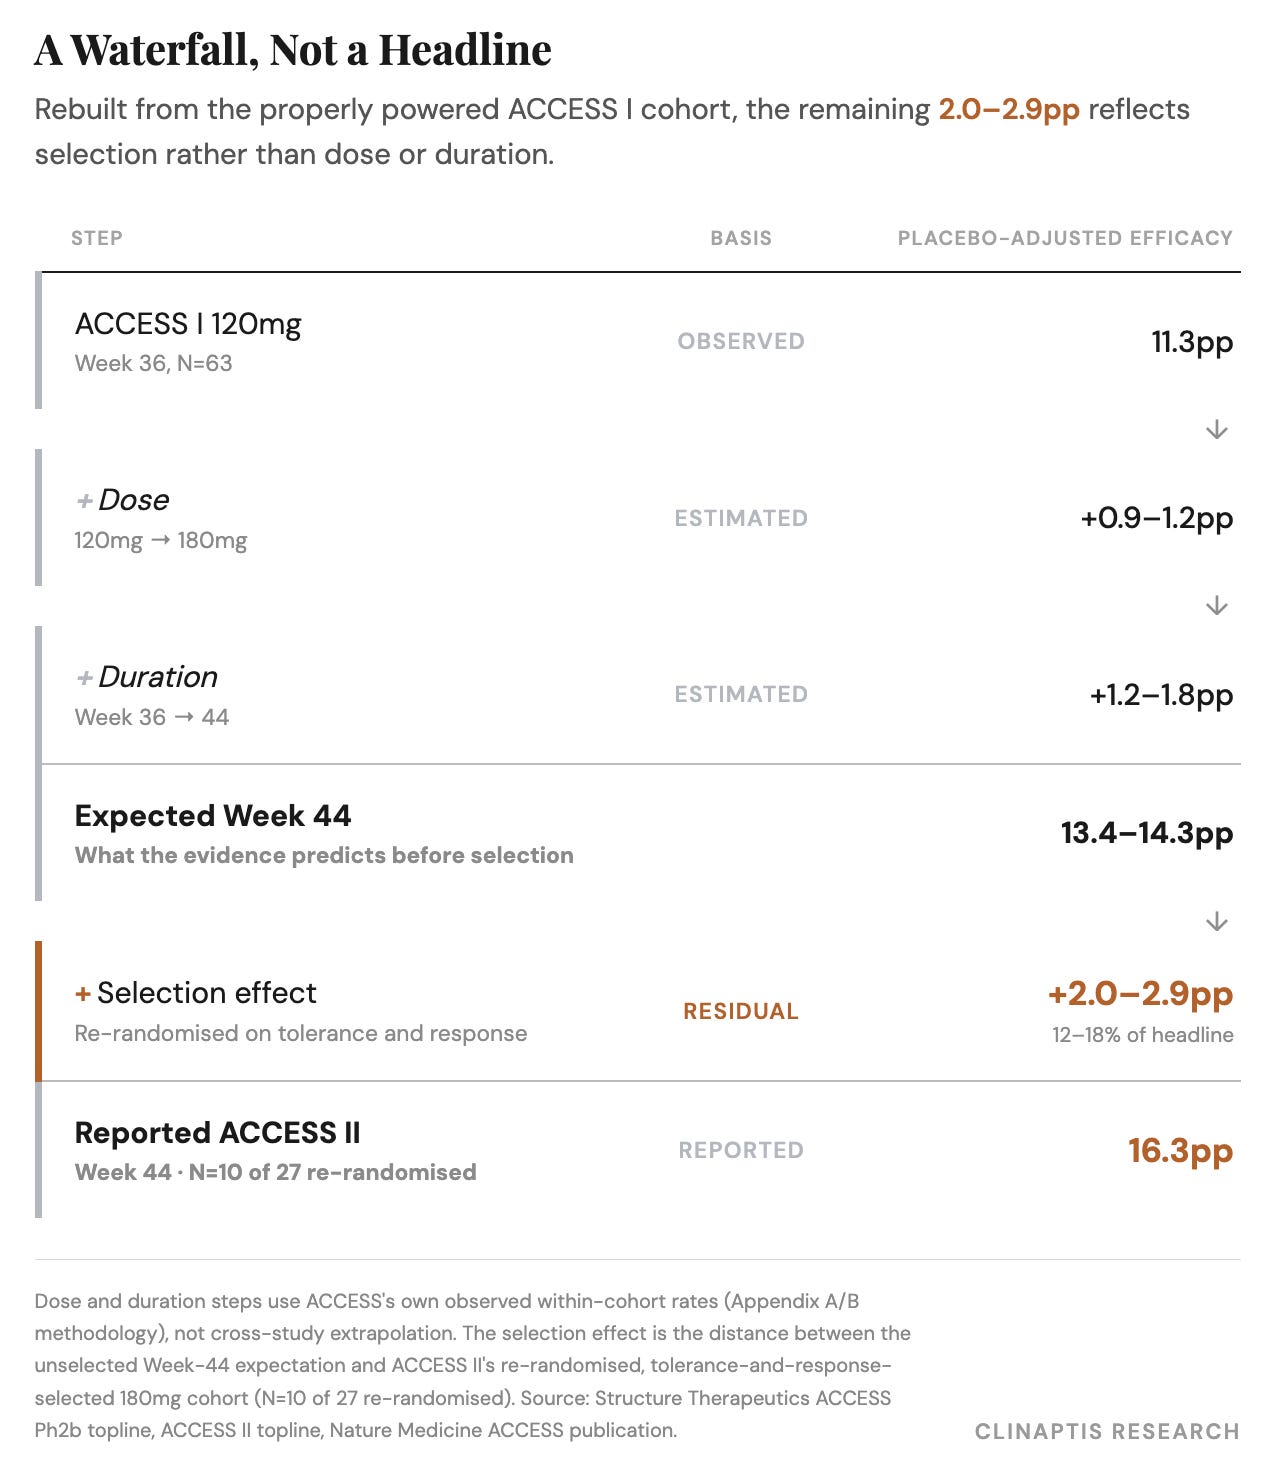
The duration adjustment is an 8-week within-study extension using the cohort’s own observed late-phase rate, not the cross-study extrapolation rejected in Appendix A.
ACCESS II also re-opened dose escalation at Week 28. By the Week 36 interim readout, patients had only eight weeks at 180mg and four weeks at 240mg, so the reported “no plateau” partly reflects renewed dose exposure rather than a stable maintenance trajectory.
The extension cohort is selected rather than representative. 27 participants entered the re-randomised extension from 61 active-treatment participants. Both the 120mg continuation arm and the 180mg arm represent patients selected on tolerance and response. The disclosed 120→180mg increment (~1.6pp) measures dose within that selected population but cannot recover an unselected 180mg effect. GPCR itself describes the extension as enriched, without quantifying the degree. The 120mg arm’s tolerability was disclosed in full — N=8, zero nausea, one vomiting event, eight of eight completing at target dose.
Dose alone cannot explain the residual. Late re-acceleration is implausible: from Week 28 to 44 the 180mg arm gained 6.4pp — twice the unselected cohort’s own late-phase rate — in patients already decelerating. A 240mg arm, double the 120mg dose, delivered less (16.0pp) at far higher vomiting (44.4% vs. 10.0%), the same saturation FDA found at orforglipron 45mg, where a 25% dose increase bought 0.4pp and the dose was cut from Ph3. 120→180mg and 180→240mg sit on different parts of the same curve, which is why a real dose effect below 180mg and a flat one above it are not in tension.
The decomposition explains the reported headline. The estimand adjustment estimates the Ph3-equivalent result. The ranking and valuation rely only on the latter.
A second, independent route to this decomposition — reconstructing the ACCESS trajectories directly rather than from summary statistics — is set out in Appendix B.
VI. Where Does the Ranking Actually Sit?
With the label-equivalent figure defined, aleniglipron can be placed on the same basis as every comparator that matters. Placebo-adjusted, longest disclosed endpoint, common estimand basis:
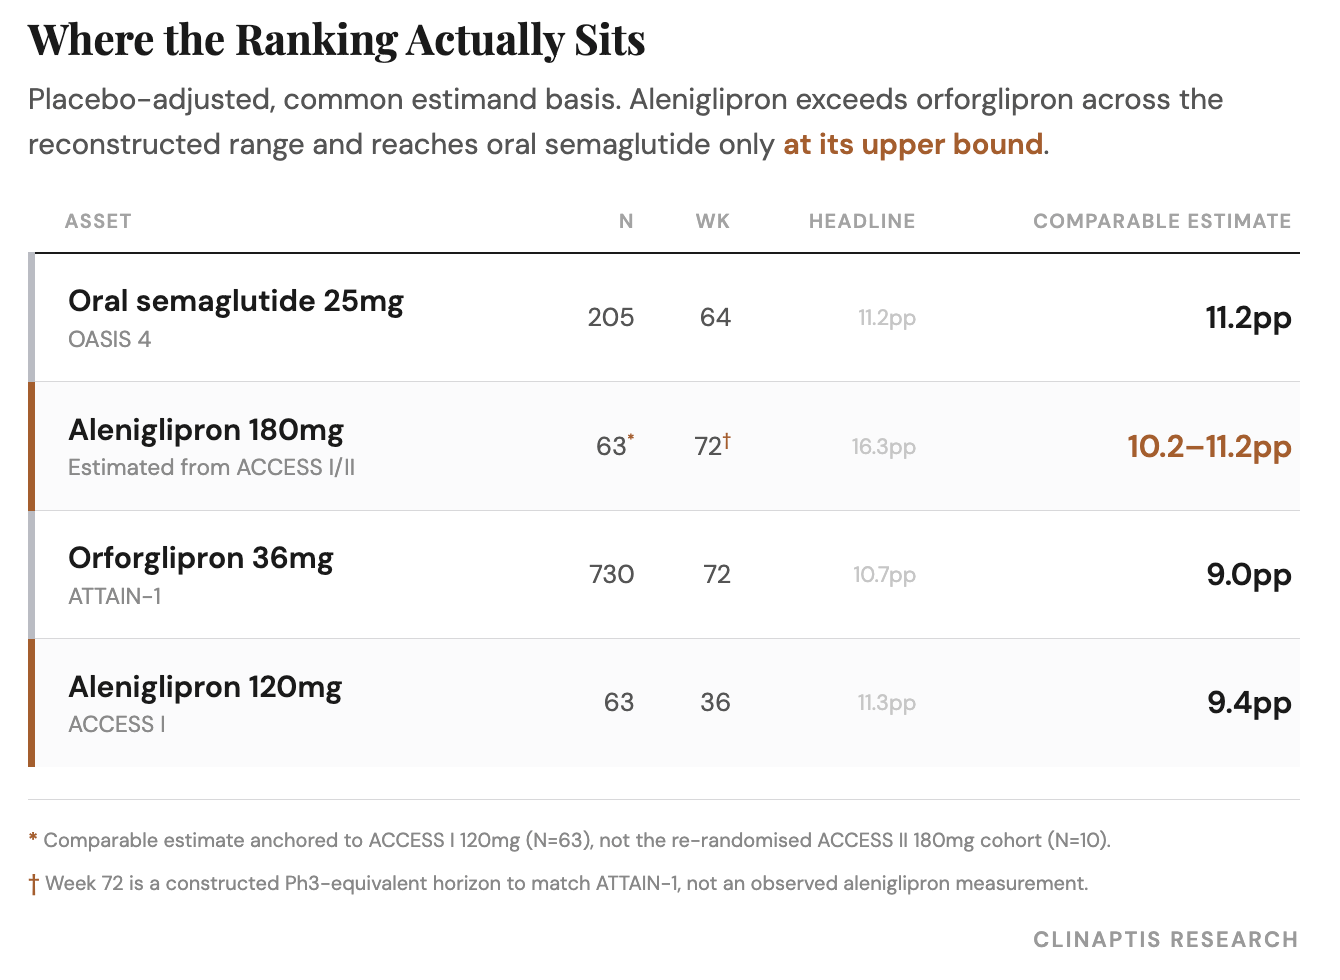
Aleniglipron clears orforglipron in every scenario we run. It reaches oral semaglutide only at the top of its range, and it arrives roughly five years after both.
1. The reliability caveat: one assumption determines the result. The March 2026 topline discloses the Primary Efficacy Estimand and LS-mean differences estimated by MMRM, but not the intercurrent-event strategy, missing-data handling, or analysis population. That framework is what mgmt. confirmed with the hypothetical-strategy family we assume, in line with GZGI’s published estimand, without fully defining it. If Ph3 adopts the treatment-regimen convention now a standard in this class, the adjustment applies as modeled; if ACCESS already ran closer to treatment-policy, the adjustment shrinks and aleniglipron looks better than we portray. The unresolved methodological detail is therefore the single most important uncertainty in the file. FDA’s draft framework, current at the End-of-Ph2 meeting, would require explicit scientific justification for any material deviation from treatment-policy, narrowing — but not eliminating — the range of plausible outcomes.
2. The scope caveat: weight loss is not the only axis. Cardiometabolic profile is a potential source of differentiation. Lilly has reported consistent improvements in triglycerides, non-HDL cholesterol and hs-CRP across the orforglipron development. Published aleniglipron data have not yet demonstrated a similarly mature lipid dataset. Whether this reflects shorter follow-up, smaller datasets or genuine pharmacology remains uncertain, and it is not incorporated into our valuation — but it previews the broader point below: weight loss is only one part of the product profile that ultimately matters.
A fourth entrant, still too early to rank. Roche’s CT-996 (ex-Carmot; $2.7bn acquisition, Dec-2023) is a Gs-biased oral GLP-1 pursuing the same signalling hypothesis GPCR cites for aleniglipron’s differentiation, while also advancing in parallel obesity and T2D programs (Nov ‘26 completion). Phase 1 data (7.3% weight loss vs. 1.2% placebo at Week 4) remain too early and too small to rank, and are therefore quarantined from the table above.
VII. Remaining Uncertainties
Selection. The largest remaining uncertainty. ACCESS II’s 120→180mg increment is observed in patients who completed 28 weeks and were re-randomised. If the same increment holds in an unselected Ph3 population, our enrichment residual is too large and the 180mg estimate is conservative.
Incremental dose effect. Our build assumes roughly a 1 percentage point efficacy gain from 120mg to 180mg in an unselected population. Ph3 or future exposure-response analyses could move that estimate modestly in either direction.
Ph2→Ph3 adjustment. The orforglipron calibration explains most observed shrinkage, but ACCESS differs in size, protocol and patient mix. The residual regression from Ph2 to registrational efficacy could therefore be somewhat larger or smaller than the analogue suggests.
VIII. What Is Priced?
None of the three remaining uncertainties is resolved, so the model carries a label-equivalent range rather than a point estimate. U.S.-only rNPV assumes a 2031 launch in the base case, consistent with a conservative development timeline.
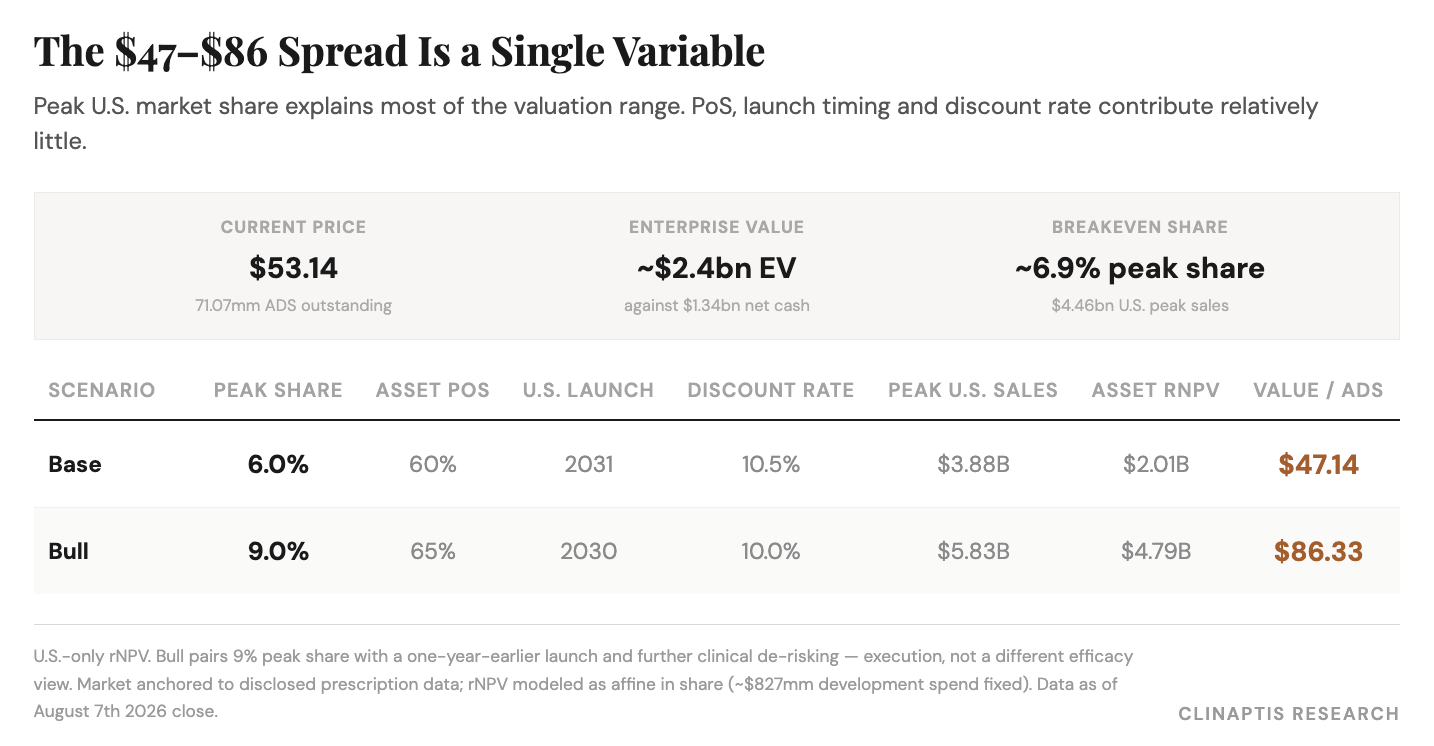
Holding PoS and discount rate at base-case levels, we break even at roughly 6.9% peak share — $4.46bn of U.S. peak sales — so the ~11% gap between our $47.14 base and spot is under one point of implied peak share, amplified by fixed development spend.
The valuation debate is primarily a debate about commercial share. We hold the PoS at 60% in the base case, increasing modestly to 65% only after additional clinical de-risking. The remaining upside therefore comes primarily from commercial execution rather than a different view of the underlying efficacy.
The base case assumes GPCR captures 6% of active U.S. branded AOM patients at peak — a differentiated third oral entrant with competitive efficacy but no assumption of category leadership. The bull case assumes 9% share, a one-year earlier launch, modestly lower execution risk and further clinical de-risking. It requires GPCR to establish near-parity with two incumbents that entered the market roughly five years earlier, a more demanding commercial outcome than the current evidence supports.
Model conventions. The U.S. market is anchored to disclosed prescription data rather than a retention-and-new-starts engine, which produces a patient pool approximately 41% larger by 2037 and a correspondingly higher valuation. We do not assume rNPV scales directly with revenue because approximately $827mm of risk-adjusted development spend is fixed. Reverse-solving under a proportional assumption understates the market-implied commercial share by roughly 70bps.
IX. What Does 2H26 Pay You?
Five major datasets land before YE26. Each tests an assumption behind the 10.2–11.2pp restatement; none should be judged against the 16.3pp headline.
ACCESS OLE, Q3. Tests durability, not efficacy. Read the shape, not the level: every comparator with both mid-study and long-duration data has flattened beyond Week 40–48, and ACCESS remains an enriched survivor cohort.
Body Composition, Q4. Extends the 2.5mg starting-dose story beyond tolerability, assessing body composition over 44 weeks while providing a second dataset for the revised titration strategy.
SWITCH, Q4. The most commercially relevant dataset. Persistence, weight regain and switch capture without titration failure determine whether oral convenience translates into durable franchise share rather than just a strong induction profile.
Diabetes/Obesity, Q4. Restores the second population needed to evaluate dose selection across metabolic backgrounds. Lilly used parallel obesity and T2D programs to support dose selection; this dataset begins to answer whether GPCR’s 180mg sits on the efficacy plateau.
Ph3 protocol details. 240mg is probably already out (2Q26 PR) from the Ph3 ACCOMPLISH-1 — ACCESS II showed it delivering less than 180mg at 44.4% vomiting against 10.0%, and the Ph3 dose ladder is expected to omit it. Three unknowns remain: primary estimand; whether GLP-1-intolerant patients are excluded before randomisation; and whether protocol-defined dose reduction is permitted.
Amylin pipeline, 2H26. ACCG-2671 Ph1 data (Q3), ACCG-3535 Ph1 initiation (Q4), and initiation of the oral GLP-1/amylin combination study (Q4) progressively determine how much of Structure’s enterprise value extends beyond aleniglipron.
One signal has already landed, on the commercial rather than clinical calendar: Lilly’s 2Q26 update shifted the Foundayo debate from efficacy toward adoption. Management reported accelerating uptake and roughly one-quarter of new obesity starts choosing the oral therapy. Independent prescription data now matter more than another theoretical efficacy comparison. Roche’s CT-996 has moved into Ph2 with long-term weight maintenance now included among its evaluated endpoints alongside weight reduction — a second signal that the competitive question across the class may be shifting from peak efficacy toward persistence and maintenance.
Ph3 initiation itself is calendar, not information.
Bottom Line
What we proved. Consensus has compared three efficacy numbers. We rebuilt the comparison. Exploratory obesity readouts and registrational efficacy are not always reported on the same statistical basis, and the gap is measurable. Using the only matched Ph2-to-Ph3 calibration obesity offers — orforglipron, the same doses run under both conventions — most of aleniglipron’s apparent efficacy loss is that translation, not the molecule. The contribution is not that estimands matter; it is that we sized the translation.
What it means for GPCR. Applied to aleniglipron, the adjustment leaves a competitive molecule. It does not leave a molecule with an established best-in-class efficacy advantage. That distinction is the investment case, because today’s valuation is driven far more by the second claim than the first.
What to do with it. We remain long in small size. Base case $47.14/ADS against $53.14 today. The remaining upside turns less on another Ph2 comparison than on whether Ph3 confirms that the efficacy advantage survives under registrational conditions.
Sources
Structure Therapeutics ACCESS Ph2b topline (Dec-2025) and ACCESS II topline (16-Mar-2026); Nature Medicine ACCESS publication (Jun-2026); June 2026 corporate deck; 1Q26 Form 10-Q; 18-Dec-2023 Form 8-K (Ph2a program update).
Eli Lilly ATTAIN-1: NEJM primary publication and supplementary appendix; Protocol J2A-MC-GZGP amendments (a) 05-Apr-2023, (b) 11-May-2023, (c) 23-Oct-2023, (d) 30-Apr-2025; Statistical Analysis Plan v1.0.
Orforglipron (Foundayo) FDA multidisciplinary review, NDA 220934 — Figures 12 and 14, Table 16, Study GZGI dose-selection and escalation history.
Orforglipron Ph2 GZGI, NEJM 2023 — design, Figure 1 escalation schedule, Week 26 and Week 36 efficacy.
Novo Nordisk OASIS-4 (oral semaglutide 25mg) FDA label and Week-64 LS means.
Roche CT-996 Ph1 topline (17-Jul-2024) and Carmot Therapeutics acquisition terms (Dec-2023).
CMS Medicare GLP-1 Bridge program negotiated pricing; CVS Caremark commercial formulary decisions.
Appendix A: Why We Do Not Project Weight-Loss Trajectories
An earlier version of this work attempted to harmonise obesity programs by fitting common weight-loss curves and projecting efficacy to matched durations. We abandoned that approach because published aggregate trial data do not uniquely identify the long-term efficacy trajectory.
The problem is identifiability, not model selection. Across ACCESS, GZGI/orforglipron, OASIS-4 and other disclosed datasets, several plausible functional forms fit the observed aggregate trajectories about equally well — in-sample RMSE of ~0.04–0.15pp — yet imply materially different long-term plateaus, diverging by as much as 4pp when extrapolated. Goodness-of-fit cannot discriminate among them, so the asymptote is not recoverable from cohort summaries regardless of which curve family is chosen. Pairwise Emax fits make the point directly: within ACCESS the implied ED50 ranges from ~22mg to over 100mg depending on the dose pair used — parameter non-identifiability, not merely imperfect fit.
Two features of the data compound this.
The trajectories are not all biology. ACCESS I and ACCESS II do not trace the same underlying curve: ACCESS II re-opens dose escalation at Week 28, producing renewed weight loss that reflects protocol design as much as pharmacology. A single smooth curve fit across both would read that step as biology.
Observed efficacy need not be monotonic. OASIS-4’s placebo-adjusted effect falls from 12.3pp at Week 56 to 11.2pp at Week 64, which no monotone curve family can represent.
Published aggregate summaries therefore do not determine a unique long-term efficacy frontier. Modern pharmacometric work does not treat this as a solved curve-fitting exercise; it relies on PK/PD exposure-response or mechanistic energy-balance models that use drug exposure, pharmacokinetics and patient-level data unavailable for published Ph2 studies. Our decision is therefore methodological rather than practical: we compare observed data or matched durations only, and do not extrapolate beyond the evidence. The extrapolation uncertainty this avoids (~1–4pp) exceeds both the competitive efficacy gaps between assets and the estimand adjustment measured in this note.
Appendix B: An Independent Trajectory Check
Section V decomposes the 16.3pp from summary statistics. This appendix asks a narrower question with a method that shares none of those inputs: are the disclosed ACCESS trajectories internally consistent with that decomposition?
We took the published week-by-week weight-loss means from the Nature supplement — 45mg, 90mg, 120mg and placebo, exact tabulated values rather than digitised figures — and fit a two-phase model to each arm: an inverse-log early phase and a saturating-exponential later phase.
Within observed durations the model holds. Dropping the Week-44 point and fitting the remaining observed weeks reproduces the held-out Week-44 value within roughly 0.1–0.4pp across all three doses.
Beyond observed durations it does not. Trained only through Week 36 and asked to project Week 40–44, the model under-predicts by up to ~1.3pp, and the error moves with the breakpoint — reproducing Appendix A’s conclusion from an independent direction. We therefore restrict the framework to within-study validation over observed durations.
The framework cannot reach the headline: no unselected 180mg cohort exists in the public data — 180mg appears only as the re-randomised, tolerance-and-response-selected extension arm — so the reconstruction ends without a new central estimate. It is directionally consistent with the Section V decomposition and provides no evidence the reported 16.3pp can be explained by dose and duration alone. It is not used for ranking or valuation; those rest on the estimand adjustment carried through the rest of this note.
Appendix C: How Certain Is ACCESS II’s Dose Ranking?
ACCESS II’s higher-dose extension enrolled roughly N=8, 10 and 9 participants across the 120, 180 and 240mg cohorts. Using the published LS means and 95% confidence intervals, we inferred the treatment-effect uncertainty and ran a Monte Carlo sensitivity analysis on the disclosed Week 36 and Week 44 readouts.
At these sample sizes the dose ranking is not robustly identified, and it does not even hold across the two disclosed timepoints. At the Week 36 interim, 240mg was numerically ahead — P(240mg > 180mg) ≈ 64%. By Week 44 the ranking reversed: 180mg became the best arm, but only weakly — P(180mg > 240mg) ≈ 54%, essentially a coin flip — while its edge over 120mg firmed to ≈ 72%. The probability that 180mg beats 240mg by a clinically meaningful (>1pp) margin at Week 44 is only ≈ 40%.
The exercise reaches a narrow but useful conclusion: ACCESS II supports dose response up to 180mg but cannot separate 180mg from 240mg on efficacy — the point estimates flip between the only two disclosed timepoints. Dose selection therefore rests on tolerability, where 240mg is clearly worse (44.4% vomiting versus 10.0% at 180mg), not on an efficacy difference the data can resolve.
Approximation based on published LS means and model-derived 95% confidence intervals rather than individual patient data.
Disclaimer: This report is independent research and reflects the author’s own analysis and opinions as of the publication date. It is provided for informational purposes only and does not constitute investment advice, a recommendation, or an offer or solicitation to buy or sell any security. Clinaptis Research is not a registered investment adviser or broker-dealer. The analysis relies on public disclosures and reasonable estimates where noted. Estimates and forward-looking statements are inherently uncertain and actual results may differ materially. The author and related parties may hold, or may in the future hold, a position in the securities discussed.