
uniQure’s AMT-130: The FDA Changed Its Mind. The Data Didn’t.
Projecting Four-Year cUHDRS and TFC Outcomes Ahead of AMT-130’s Q3 2026 BLA, Confirmatory Trial, and Commercial Launch in Huntington's Disease (HD)

June 17 changed the investment case for AMT-130. QURE had traded in the mid-$20s through May and into mid-June before the FDA agreed that three-year Ph1/2 data could support a BLA under the accelerated approval pathway.— reversing its November 2025 position on the identical public dataset — and the stock moved from $27 to $48 in a single session, holding that range since through a dilutive secondary. The regulatory question is mostly answered. The market still has to answer the clinical one. BLA submission targets Q3 2026, on the strength of three-year Ph1/2 data against a propensity-matched external control. A long-term clinical update arrives the same quarter — and nobody has published a pre-specified framework for what that readout needs to show before it shows it.
The market seems to be treating them as one catalyst. They aren’t. BLA filing is a near-certainty given where the FDA landed in June. Whether the four-year data continues to pull away from natural history, plateaus, or starts drifting back toward it is a separate, unresolved question — and the answer determines whether this becomes a franchise or stays a confirmatory-trial-dependent option. At ~$2.42B EV, current valuation assumes an approval-contingent value of $2.8-4.0B depending on what probability you assign — a reasonable bet on a drug with the most compelling functional dataset HD has ever produced, built on twelve evaluable patients and an external control with an unquantified temporal drift problem.
This note starts from a different place. Rather than simply preview the four-year update, it projects where the key functional endpoints are likely to land, what those outcomes would imply clinically, and what today’s valuation is actually assuming.
I. Biology: What HTT Lowering Does and Doesn’t Prove
AMT-130 delivers an AAV5-miRNA construct directly into the striatum through MRI-guided stereotactic neurosurgery, a 12-20 hour procedure. The miRNA lowers both mutant and wild-type HTT post-transcriptionally, reducing accumulation of the toxic huntingtin protein driving neurodegeneration in the caudate and putamen. The biological rationale isn’t in question: PREDICT-HD data show that putamen volume loss carries a 3.32× higher hazard of conversion, so striatal preservation maps directly to future motor and cognitive trajectory.
What the mechanism doesn’t settle is dose-response linearity — and that’s worth flagging before the efficacy data, not after. High-dose produced a –0.38 cUHDRS change from baseline versus a control of –1.52; low-dose produced –1.65, worse than untreated natural history. QURE and KOLs have set this aside as consistent with dose-response biology. It still belongs in any honest reading of the BLA package.
The field’s history raises the stakes. Tominersen — Roche’s ASO lowering both mutant and wild-type HTT — was halted in Ph3 GENERATION-HD1 in 2021 after higher-dose patients showed worse outcomes than placebo, likely from excessive wild-type suppression. AMT-130 also lowers wild-type HTT; how much suppression is tolerable is the question tominersen left unanswered. PTC-518 showed meaningful HTT lowering in Ph2 but a more modest functional signal — Novartis is now taking that program to Ph3. he lesson is the same: biomarker response is necessary, but it has never been sufficient. Wave’s WVE-003 took the opposite mechanistic bet, preserving wild-type HTT entirely; early SELECT-HD data show mutant HTT down 46% with no functional read yet. Three different answers to the same open question — how selective does HTT lowering need to be — and today only AMT-130 has three years of functional data behind its answer.
II. What the 36-Month Data Actually Shows
The headline is 75% slowing of disease progression on cUHDRS at 36 months (p=0.003). That’s real, and statistically persuasive, but percentages obscure what actually happened. In absolute terms, AMT-130 produced a 1.14-point cUHDRS difference (−0.38 vs. −1.52) and a 0.52-point difference in Total Functional Capacity (TFC) (−0.36 vs. −0.88). Those are the numbers regulators, physicians, and ultimately payers will judge.
TFC at 36 months (p=0.033) is the clinically decisive number. cUHDRS is susceptible to practice effects in unblinded long-term follow-up. Patients taking SDMT and Stroop repeatedly become better at taking the tests. TFC cannot be rehearsed: functional capacity across occupation, finances, domestic tasks, and ADLs is what it is. TFC is where the clinical judgment lives. cUHDRS is where the p-value lives. CSF NfL at –8.2% from baseline adds biological coherence — a neurodegeneration marker staying below baseline at three years is consistent with disease modification, not symptomatic masking.
The propensity-matched external control is stronger than it’s often given credit for. Age, CAG repeat, CAP100 score, and baseline TFC and cUHDRS are all closely aligned - within a few tenths of a point. The legitimate concern is temporal, not patient-level: Enroll-HD enrolled patients from ~2012, AMT-130 patients from ~2019–2021, and if standard-of-care management of early HD improved over that decade, historical controls may be systematically undertreated relative to treated patients. This “NHS drift,” named explicitly by Truist’s CHDI KOL, is unquantified in the BLA package and is the most plausible source of residual confounding. It doesn’t invalidate the result — it frames the confidence interval appropriately, and it’s the same kind of era-effect question that resurfaces when projecting the trajectory forward to 48 months.
HTT Lowering Is Validated. Functional Durability Is Not.
Multiple platforms have confirmed huntingtin can be lowered in HD patients — that question is settled. The differentiator is whether lowering translates into durable functional preservation, and AMT-130 is the only program with publicly available three-year functional data showing sustained separation from natural history. GENERATION HD2’s DMC dropped the 60mg arm in favor of 100mg q16wk, an operational signal, not efficacy data — Roche remains the field’s most credible competitor, but investors don’t yet know what it will show. WVE-003 demonstrated strong target engagement (mutant HTT –46%, wild-type preserved) but SELECT-HD was a biomarker study, not a clinical efficacy trial. Pridopidine’s TFC signal was post-hoc in a subgroup after its primary endpoint failed.
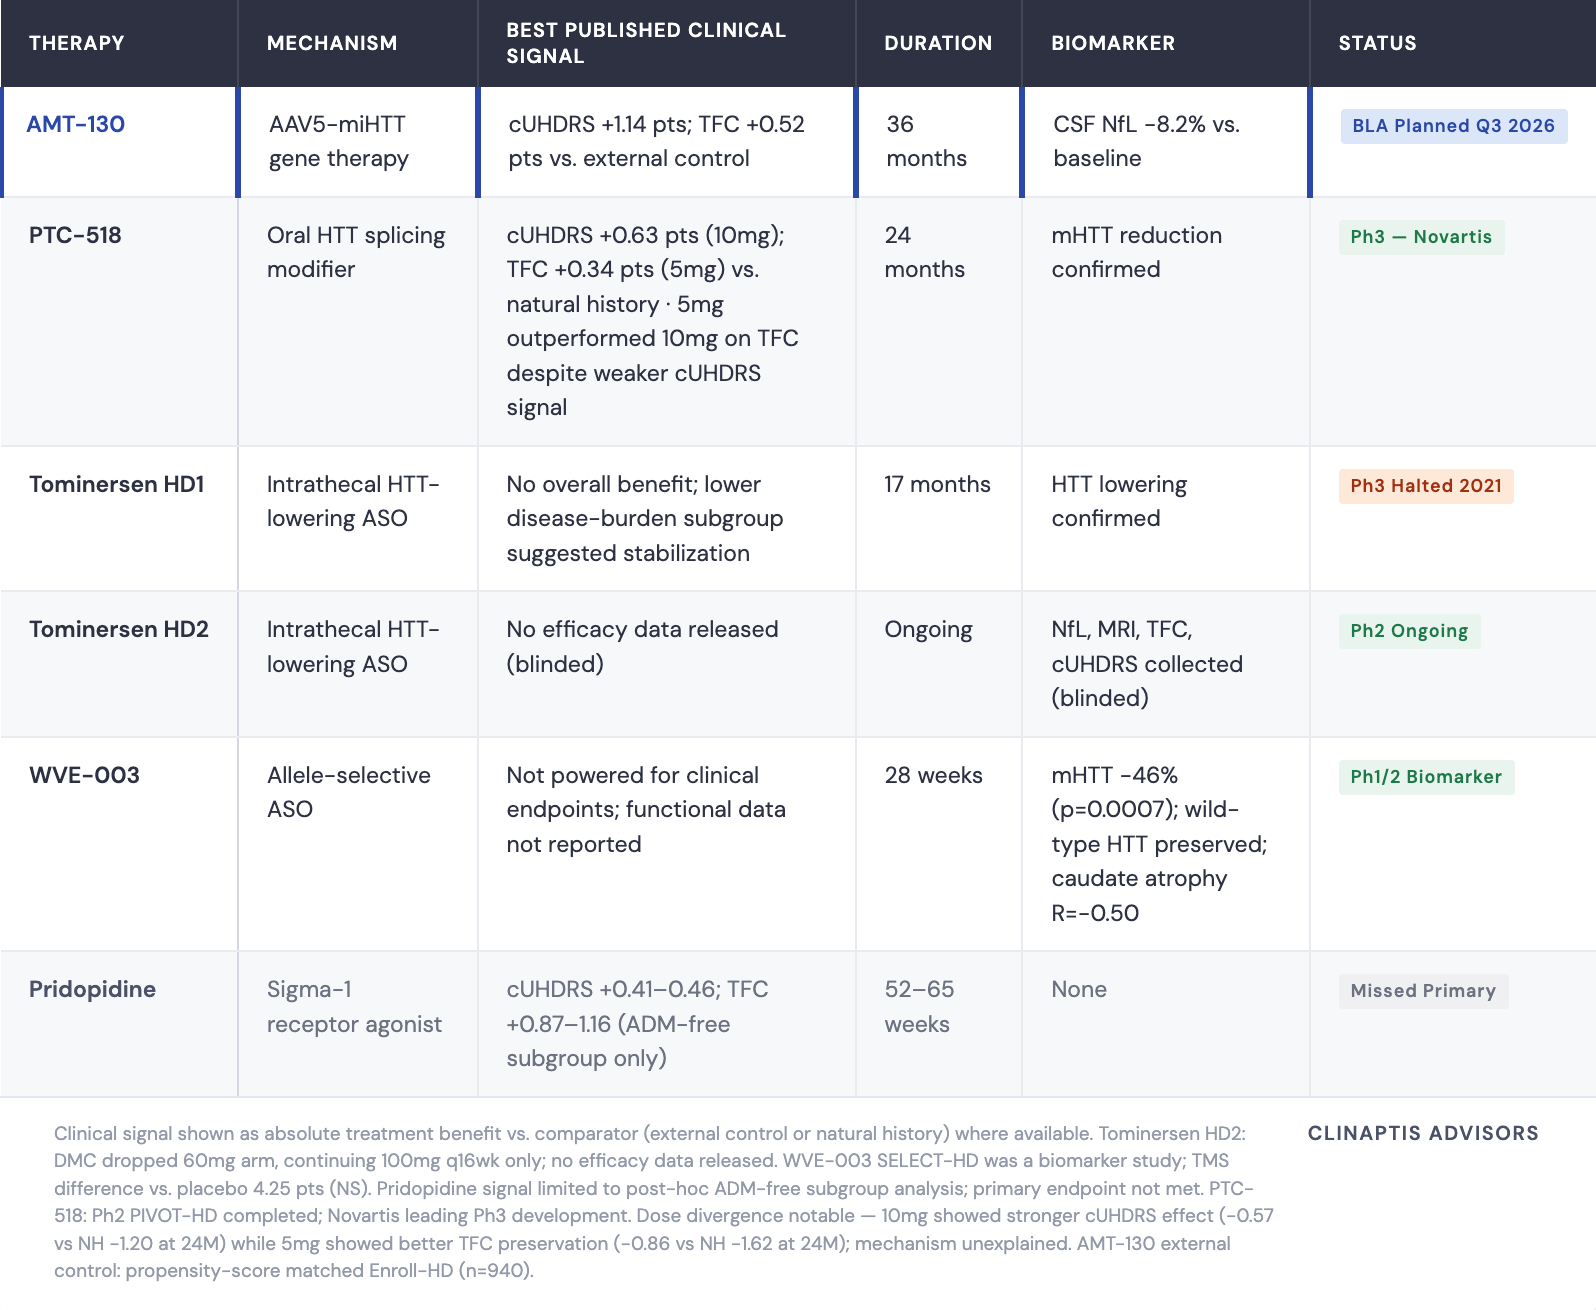
One comparison is worth carrying forward. At 24 months, AMT-130’s advantage was disproportionately large on cUHDRS (~0.70–0.75 pts vs. natural history) relative to TFC (~0.30 pts), while PTC-518 showed roughly equal separation on both. That asymmetry — a composite cognitive-motor signal exceeding what functional preservation alone would predict — is the open mechanistic question the four-year data needs to resolve. Does the TFC gap catch up to the cUHDRS lead, or does it confirm that AMT-130’s benefit is real but unevenly distributed across domains? That’s where the trajectory data starts to matter more than any single comparison.
III. The Four-Year Data Framework: Where the Real Debate Lives
BLA submission and four-year data arrive the same quarter. They are not the same event.
BLA submission (Q3 2026) rests on the three-year dataset. Filing is not approval — acceptance and accelerated approval remain review-dependent.
Four-year data (Q3 2026) is analytically independent. QURE submits it as a supplemental update after filing, not as part of the primary package. Strong four-year data increases approval confidence and shortens label negotiation; data converging toward natural history creates a credibility problem even with the BLA filed.
TFC Trajectory: Three Phases, Not a Plateau
The 36-month TFC data are usually presented as evidence of sustained benefit. The full trajectory tells a more interesting story.
High-dose AMT-130 moved through three distinct phases. In the first eight months: a post-surgical dip to –0.50, consistent with procedural effects and the time required for stable AAV5 transduction. Months 8–18: a genuine reversal — mean TFC recovered to +0.10 above baseline at months 15 and 18, the average treated patient functionally better than at enrollment. By 24 months, TFC re-declined to –0.30, reaching –0.36 at 36 months. The external control tracked linear deterioration throughout: –0.15 at 12 months, –0.60 at 24 months, –0.88 at 36 months.
The mid-trial recovery above baseline is the most striking and least-discussed feature of the dataset. It is consistent with delayed HTT lowering taking full biological effect as miRNA expression stabilizes — plausible mechanistically, but also possible in a small unblinded study. What it is not is a plateau. One additional observation: treated-arm SE narrows from ±0.24 at 12 months to ±0.20 at 24 months despite n falling from 17 to 15 — attrition normally increases variance. Treated patients may be converging on a similar trajectory post-surgery, a signal of biological consistency.
The 48-Month Projection: Integer Patient Model
With n=12 and TFC as a 13-point ordinal scale, conventional regression on three post-baseline timepoints overfits by construction. A more transparent approach: model outcomes as discrete patient-level transitions.
At 36 months, mean ΔTFC = –0.36 across 12 patients. Each net TFC point lost across the cohort moves the mean by 1/12 = 0.083. Future means are directly interpretable as integer patient transitions — no curve-fitting assumptions.
The external control reaches approximately –1.05 to –1.10 by 48 months following its linear trend.
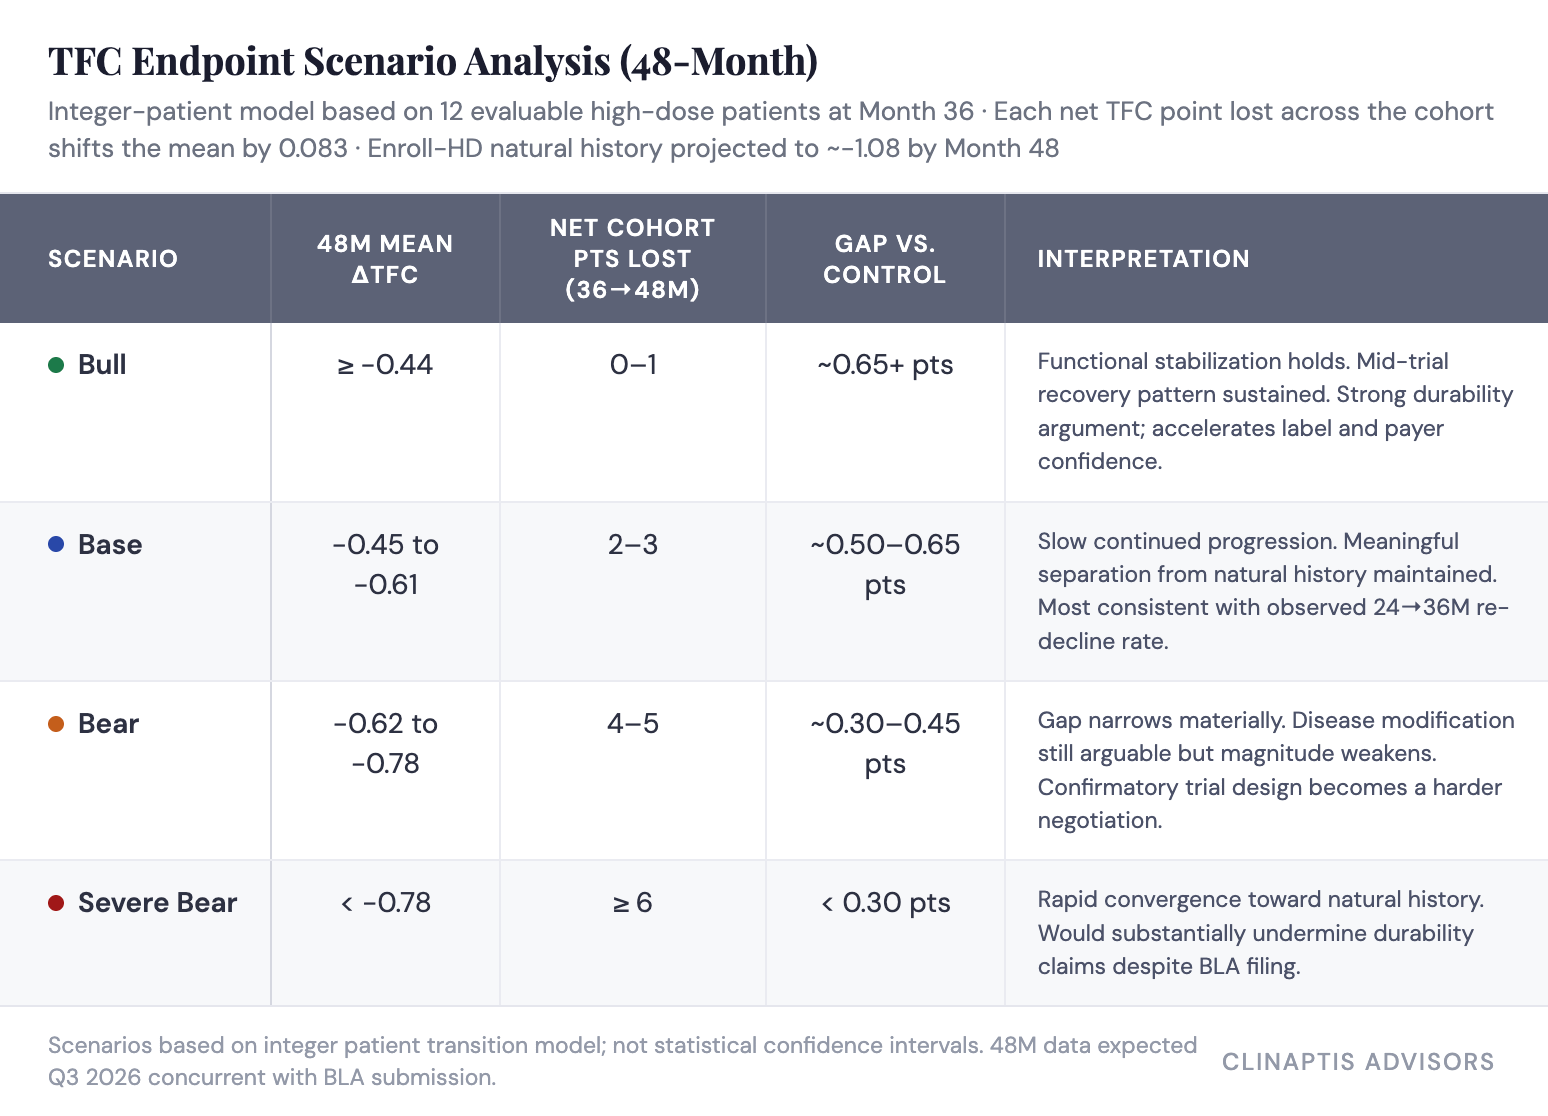
The base case is the most defensible prior: 24→36M incremental decline was –0.06, implying 0–1 net cohort TFC points over that interval. Extending that rate to 48 months produces approximately –0.42 to –0.50 — straddling bull and base. Bear requires an acceleration of decline the 24–36M trajectory doesn’t support, though the wide SEs make it possible.
The honest caveat: patients lost to follow-up are rarely random — faster progressors drop preferentially. If the 48-month evaluable cohort shrinks to 9 or 10, each patient carries ~10–11% of the mean. One patient’s clinical course is a market event.
cUHDRS at 48 Months: A Separate but Complementary Read
cUHDRS is the primary endpoint — the number the FDA accepted for the BLA. It requires different modeling than TFC: a continuous composite of four domains (TFC, TMS, SDMT, SWRT) rather than an ordinal scale, so the integer transition framework doesn’t apply. The appropriate lens is a weighted longitudinal fit.
The observed trajectory tells a consistent story with TFC: an early rebound to +0.10 at 12 months before declining to –0.25 at 24 months and –0.38 at 36 months, against an external control deteriorating steadily (–0.50, –0.95, –1.52). Extending the control trend linearly puts it at approximately –2.0 to –2.1 by 48 months.
The treated-arm projection depends on which slope assumption is used. A full-period linear fit across all three observed timepoints runs optimistic (~–0.51) because the early rebound pulls the slope upward — it implicitly treats the 12-month recovery as part of a trend rather than a transient phase. Anchoring only to the post-rebound interval (12→36 months) is more conservative (~–0.66) but discards information from the full trajectory. We use SE-weighted linear fit (~–0.64), which downweights the noisier early timepoints — where the treated-arm SEs are widest — in favor of the tighter, more reliable 36-month read. That weighting approach is standard practice for longitudinal projection with heteroscedastic variance across visits, and it sits between the optimistic and conservative anchors rather than at extremes.
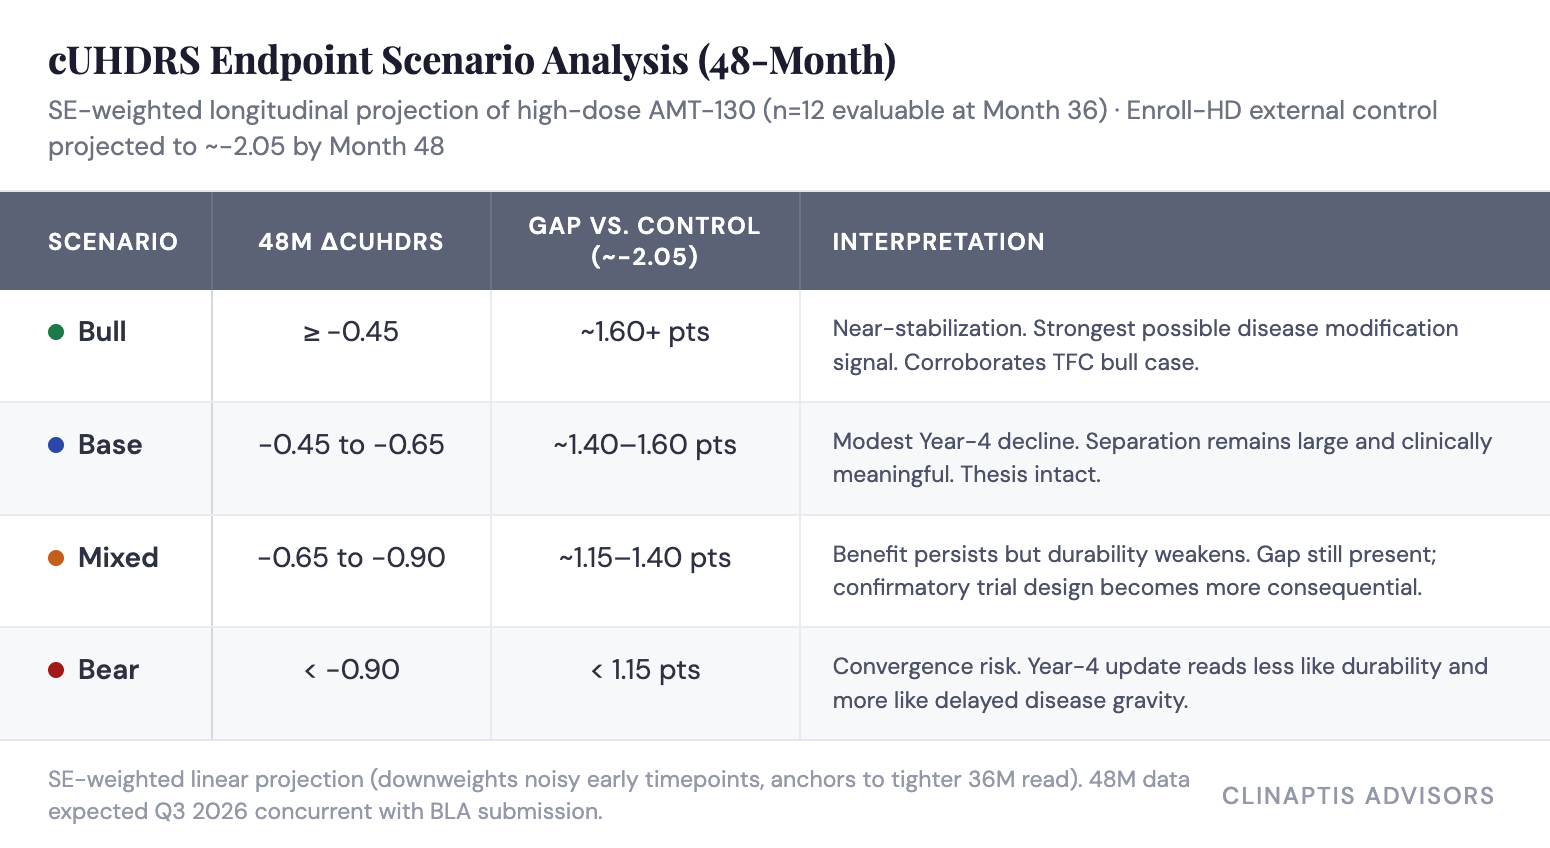
Even the bear scenario leaves a numerically large gap — cUHDRS is harder to fail dramatically than TFC because the composite dilutes individual domain noise, so “durability weakens” rather than “approval thesis collapses.” The offsetting risk is practice effects: an unblinded patient repeating SDMT and Stroop over four years improves from familiarity regardless of disease status, which is why TFC carries more clinical weight with reviewers despite being secondary.
Independent PREDICT-HD analysis cuts the other way, though: TFC ranked 32nd of 34 baseline predictors in a 1,078-patient natural history study, well behind motor and cognitive measures. The FDA’s acceptance of cUHDRS as primary isn’t endpoint fashion — it reflects genuine evidence that motor and cognitive measures carry more early-progression signal than TFC alone.
Statistical Robustness
Back-solving from p=0.003: the 1.14-point treatment effect would need to erode by ~0.39 cUHDRS points before crossing p=0.05. Using implied SD ~1.14 (derived from SE ~0.33, n=12), that requires roughly 4–5 patients losing the full treatment-control separation, or 2–3 patients showing clinically meaningful deterioration, or one outlier worsening by ~4.5–5.0 cUHDRS points in a year.*
TFC has far less statistical buffer than cUHDRS. With n=12, each net cohort point shifts the mean by 0.083 — which is why the four-year TFC trajectory carries more interpretive weight than the headline cUHDRS number. Anchor to TFC separation first, cUHDRS absolute value second.
*SD implied from SE = SD/√n; subject to revision when the full publication provides variance components.
IV. Regulatory Context and Confirmatory Trial Design
The FDA Oscillation
December 2024: FDA aligns in Type B meeting — Ph1/2 data with external control can serve as primary BLA basis for accelerated approval.
September 2025: Positive 36-month topline data.
November 2025: FDA reverses at pre-BLA meeting, stating Ph1/2 data with external control is insufficient. Strongly recommends a prospective, randomized, double-blind, sham-surgery-controlled study. uniQure disputes that the agency is reversing a prior written commitment.
March 2026: A senior FDA official publicly states the agency never agreed to accept “this distorted comparison” and that no such written or verbal commitment exists in the record — directly contradicting uniQure’s characterization of the November reversal.
Q2 2026: uniQure requests a fresh Type B meeting to discuss Ph3 design.
June 2026: FDA re-aligns. Three-year data acceptable for BLA under accelerated approval; SoC control replaces sham surgery for the confirmatory trial.
The data did not change between November 2025 and June 2026. What changed was the forum: QURE didn’t contest the November ruling, it requested a structured Type B meeting and came back with a workable path. That sequencing matters — the reversal wasn’t the FDA spontaneously reconsidering the same package, it was the product of a specific regulatory process that uniQure initiated.
The more parsimonious explanation for why that process succeeded is leadership transition — the Califf-era reversal gave way to a Makary/Prasad posture more favorable to rare disease gene therapy. uniQure’s CEO, in November, framed the rejection diplomatically: the company hadn’t reached alignment but believed “the totality and durability” of the data warranted continued dialogue on regulatory flexibility. That’s a company describing a closed door it intended to reopen through process, not a data package it believed needed strengthening. The June outcome validates that read.
The current alignment reflects a regulatory philosophy, not a settled scientific standard. The confirmatory trial is the mechanism by which that standard gets established independently of who runs CBER.
The Confirmatory Trial: Same Evidentiary Burden, Different Headache
Dropping sham surgery removes the ethical barrier, not the statistical problem. Replacing it with a concurrent SoC control arm shifts the debate from surgical feasibility to bias control, endpoint power, and duration.
The likely design: AMT-130 plus SoC versus SoC alone, randomized 1:1 or 2:1, cUHDRS primary, TFC key secondary, endpoint raters blinded. But a patient who knows they received gene therapy and a clinician who knows which arm they’re treating create motivational and observational asymmetries a blinded rater cannot fully correct.
The power math is the hidden valuation variable:
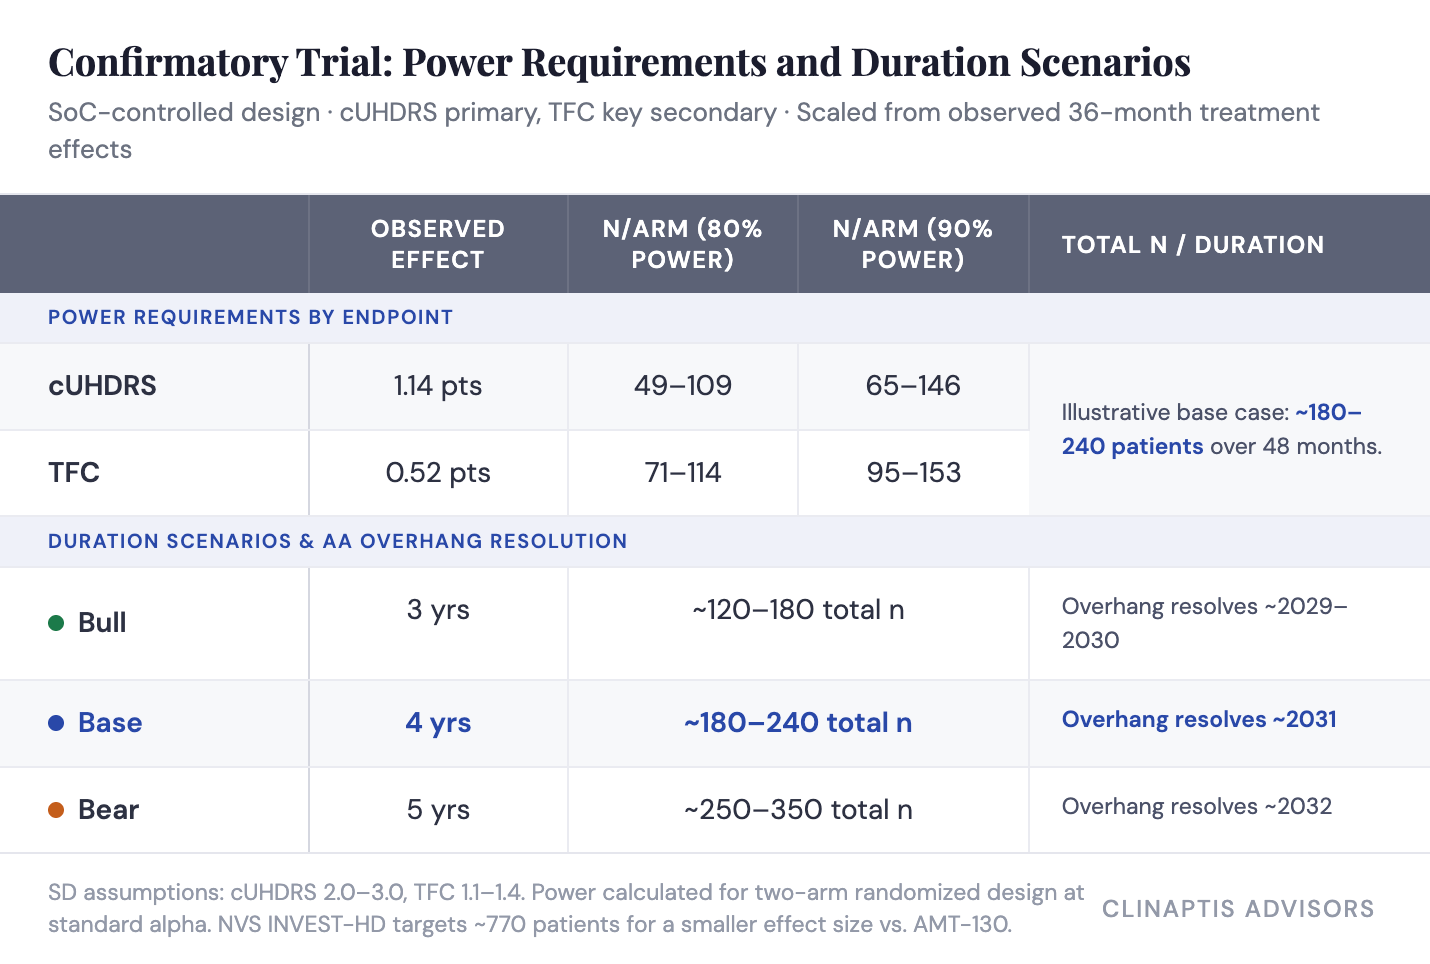
A credible confirmatory study likely requires ~180–240 total patients over 48 months — the base case. Duration drives how long the accelerated approval overhang persists.
Two structural risks compound this. SoC heterogeneity — “standard of care” in early HD spans VMAT2 inhibitors, antipsychotics, PT/OT, and varying clinic intensity across 23 countries — enters the control arm as noise and erodes power. Post-approval enrollment friction is the other: randomizing newly diagnosed HD patients to SoC alone becomes ethically and commercially harder once AMT-130 is commercially available, and that friction compounds the longer the trial runs concurrent with launch.
V. Commercial Reality and Valuation
The Surgical Bottleneck Is the Binding Constraint
~75,000 patients carry manifest HD across the US, EU, and UK. AMT-130 targets early manifest disease (HD-ISS Stage 2–3) — roughly 40–50% of the prevalent pool, or 30,000–37,500 patients. After surgical candidacy and diagnosis-rate filters, the initially addressable population narrows to ~9,000–18,750.
The launch constraint is not demand. It’s surgical capacity. Hemgenix — the closest commercial analogue, though not a perfect one — reached only ~75 cumulative patients globally across three years despite standard IV infusion and no surgical requirement at all. Roctavian is the sharper cautionary tale: withdrawn from the market entirely in early 2026 after BioMarin failed to find a buyer, undone in part by competing against an entrenched non-surgical standard of care that HD doesn’t have. AMT-130 requires MRI-guided bilateral stereotactic neurosurgery at specialized centers, followed by multidisciplinary perioperative care; capacity builds center by center, not infusion chair by infusion chair. We model the launch from surgical throughput, not addressable population.
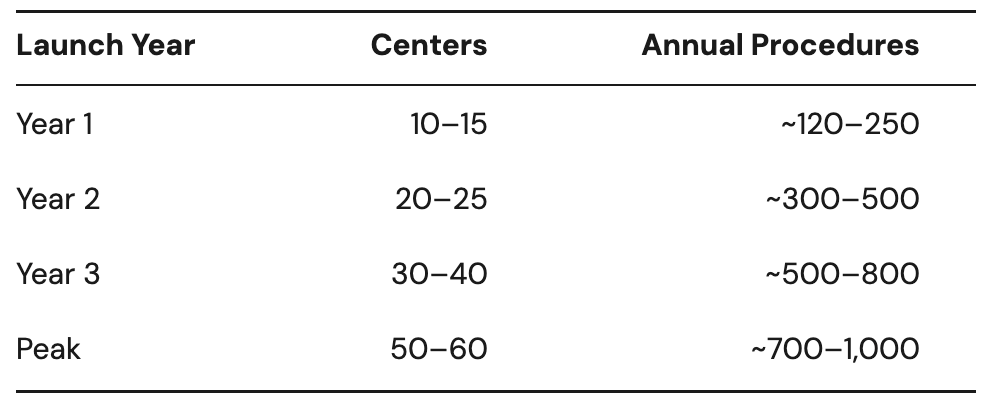
Even if physician enthusiasm and patient demand exceed expectations post-approval, commercial adoption cannot outpace neurosurgical center expansion. Early revenue is governed by infrastructure, not market size.
Revenue Model
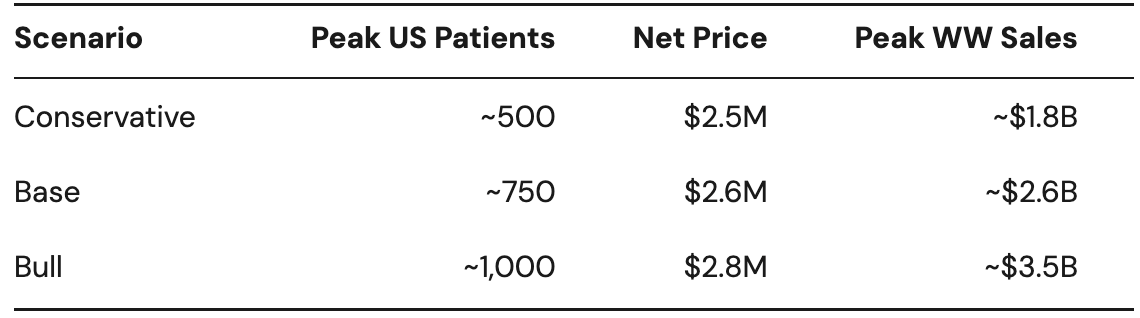
Gene therapy pricing precedent suggests list price of $3.0–3.5M; outcome-based reimbursement and international pricing dynamics imply realized net pricing below list. We assume $2.6M average net price per patient.
Base case: ~750 peak US patients by Year 5–6 generate ~$1.9B US revenue. With EU/UK contributing ~35% of US sales, worldwide peak revenue reaches ~$2.6B — before gradual erosion as next-generation HTT-lowering competitors (allele-selective ASOs, oral splicing modifiers) arrive.
What Today’s EV Requires
uniQure closed its upsized June 2026 offering at $45.50, issuing 5.69M shares including full greenshoe exercise, raising ~$259M gross. Post-raise: 68.72M shares outstanding, ~$829M cash. At ~$210M annual burn, approximately four years of funding — sufficient to complete BLA review, initiate the confirmatory study, and prepare for commercial launch without another raise. At the June 29, 2026 close of $47.25, market cap is ~$3.25B and enterprise value ~$2.42B.
Rather than compressing regulatory probability and commercial multiple into one calculation — a step that mixes approved-asset economics with pre-approval risk in a way that doesn’t hold together — we ask a narrower question: what approval-contingent franchise value does today’s EV imply, isolating accelerated approval risk alone?
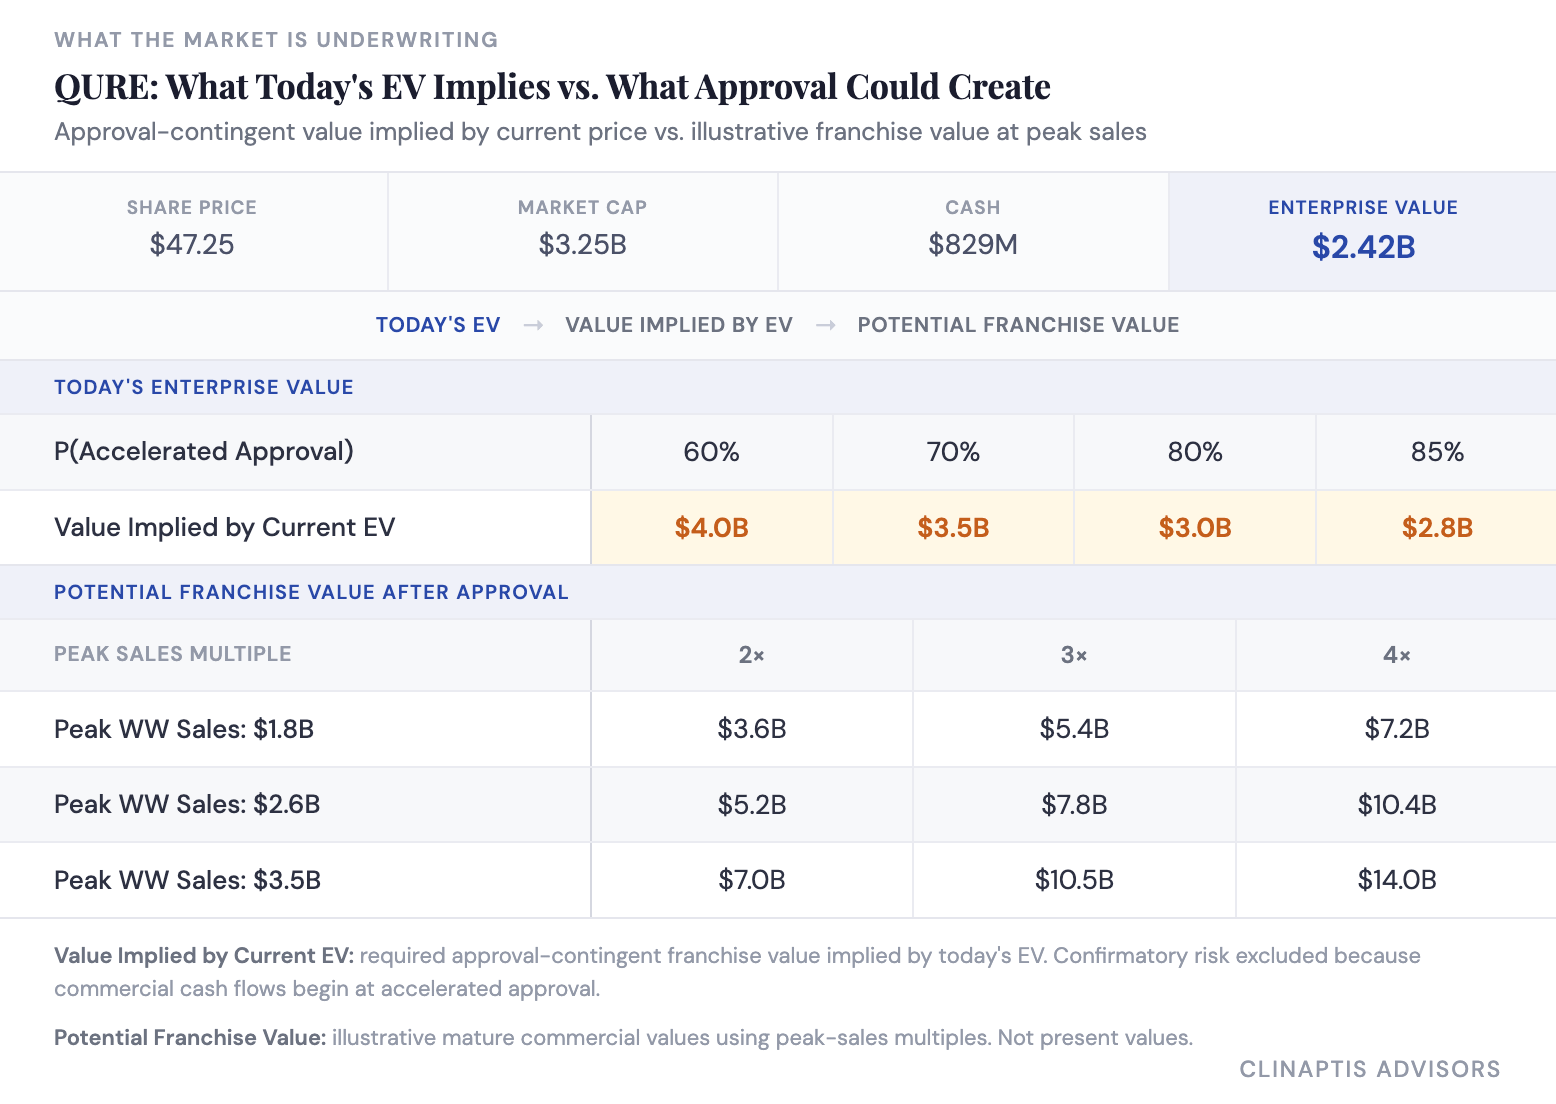
The gap between the two blocks is the real question. Standard peak-sales multiples already embed typical ramp timing and discounting — what they don’t capture is whether AMT-130’s execution risk runs higher than a normal gene therapy launch, given the surgical bottleneck argued above, or whether it gets there at all. The stock does not screen rich on peak-sales math; an implied franchise value of $2.8–4.0B at current EV is not demanding against $5.2–14.0B of illustrative mature value. The debate is whether the market is correctly pricing the years of execution risk between approval and a realized franchise: whether the four-year data strengthens the disease-modification narrative, how quickly surgical capacity scales, and how long AMT-130’s commercial lead holds before next-generation HTT-lowering therapies arrive.
The confirmatory study remains the principal long-term overhang, unresolved before ~2031 in the base case. Accelerated approval removes regulatory risk. It does not remove confirmatory risk. Size accordingly.
Bottom Line
AMT-130 is the most credible disease-modifying dataset HD has ever produced. Motor, cognitive, functional, and biomarker endpoints moved together at 36 months; the TFC trajectory shows a three-phase pattern consistent with delayed biological effect; safety at three years is clean against a field where tominersen’s Ph3 failure established that HTT lowering at scale is not automatically safe.
The evidentiary architecture has real constraints: n=12 evaluable high-dose patients, an external control with an unquantified temporal drift concern, a regulatory endorsement that reversed twice in 18 months, and a confirmatory trial design not yet finalized. The cUHDRS primary requires 4–5 patient deteriorations to lose significance — not paper-thin. TFC sits on narrower statistical ground and is the endpoint that matters clinically. None of this is a reason to be short QURE into a BLA filing in a favorable regulatory environment. It is a reason to understand exactly what you own.
Watch two numbers when the four-year data lands: TFC absolute separation (hold above 0.50 points, ideally widening toward 0.65–0.80) and the evaluable n (below 10, fragility worsens materially). If both hold, the disease-modification thesis compounds. If either breaks, a 48-month confirmatory trial with a heterogeneous control arm becomes load-bearing through ~2031.
The three-year package is sufficient to support a filing. The four-year data will determine whether the story becomes more convincing or more dependent on what comes next.
Clinaptis Advisors — Huntington’s Disease | Gene Therapy |
Disclaimer: This note is published by Clinaptis for informational and educational purposes only. Nothing herein constitutes investment advice or a recommendation to buy or sell any security. Clinaptis is not a registered investment advisor or licensed financial professional. All data and market figures referenced are sourced from publicly available information including company filings, earnings transcripts, clinical trial publications, and regulatory disclosures. Where figures are triangulated or estimated, this is noted explicitly in the text. Readers should conduct their own independent research and consult a licensed financial advisor before making any investment decision.
Clinaptis publishes independent market structure commentary on pharmaceutical and biotech categories. All views are the author’s own.