
Where Bears Are Still Building In XBI
Why crowded shorts have already priced the bear case — and where the marginal short is actually arriving.

XBI SMID · June 30 settlement · Inaugural edition — Clinaptis Monthly Biotech Short Interest Monitor
Most-shorted screens produced by brokerage desks read the June tape the way they have read every rising tape for the last decade: aggregate short interest (SI) is up, so the names at the top of the list must be the squeeze list, and rising SI across a cohort must be broad bearishness. Two of those inferences are wrong this month, and the tape is more interesting once you separate what the screens are actually measuring.
Placed on two axes — current SI (as % of float), and the one-month change in shares short — the 65-company $1–5B XBI cohort separates into four regimes that behave differently and reward different trades. Bears still pressing (high level, rising flow) is where conviction and momentum agree; it is nearly empty this month, and that emptiness is the signal. Mature crowded shorts (high level, quiet flow) is where the top of the ranking actually lives — everyone who intends to be short already is, and the marginal short has moved on. Emerging shorts (low level, sharp build) is where theses form from small bases. The low-and-quiet quadrant is the resting state of this niche biotech market where mild bearishness is the default.
Reading the short-interest tape
The direction, first: the tape is broadening and concentrating at the same time. Aggregate SI rose again in June and 71% of names printed higher — that is broadening. But the mean M/M Δ (+11.8%) came in nearly double the median (+6.6%), which is concentration on top of that broad rise. Both are happening; neither in isolation is the story. The marginal short dollar is landing in a relatively small group of names inside an otherwise broadly bearish tape. The interpretive error is treating either observation as sufficient on its own.
The level, second — and the harder call: the top of the SI list is not the squeeze list. High SI% reads reflexively as squeeze fuel, but the most-crowded names are not where positioning is building. NTLA sits at 44% of float and moved +1.4% M/M. Strip TYRA (the exception the framework is designed to surface) and the remaining top-nine SI% names carried a median M/M Δ of ~6.7%, essentially at the cohort’s +6.6%. The top of the list is tracking the group, not accelerating on top of it — and that absence of coordinated pressure into names already carrying the largest short piles is the signal. If bears were deepening conviction where they already had it, you would see those names outrun cohort. They are not. The marginal short dollar has more likely moved on to fresher targets than deepened into existing ones — a nudge past a coin toss, not a proof. A positive print into a mature crowded short therefore surprises the marginal long, because no meaningful incremental short is still arriving. The level tells you where positioning accumulated; the change tells you where it is going. Those two decoupled in June, and the decoupling is the signal.
Methodology. We screen biotechnology companies of $1–5B market cap using FINRA short-interest data settled June 30, 2026, against the May 29 settlement. Sub-$1B names are excluded — tiny floats, financing overhangs and liquidity effects distort the signal. >$5B names are excluded because short interest there reflects commercial franchises, index flow and hedging rather than directional expression. The $1–5B band is the institutional battleground where valuation, clinical catalysts and sentiment intersect.
Two caveats worth stating rather than burying. Float diverges meaningfully across data vendors, so SI% level is directional rather than precise; interpretation is anchored on the two float-independent measures — the change in shares short, and estimated dollar exposure. Market cap is as of the July 10 close while SI and float data are as of the June 30 settlement; the ~10-day seam is immaterial to the cohort framing, though a small number of dollar figures and boundary names would shift on settlement-dated prices.
The Positioning Map
The universe at a glance. Median SI is 18.7% of float, mean 20.3% — so ~19% is the correct benchmark for “crowded” in today’s SMID biotech, which means a 20% name is average, not alarming, and only the high-20s and above genuinely qualify as consensus shorts. Aggregate estimated dollar short exposure is ~$23.4B, spread across a mean position of ~$361M and a median of ~$342M. That last pair carries a quiet signal. Mean and median dollar exposure nearly coincide even as mean and median change diverge sharply, which means the standing base of short capital is distributed fairly evenly across the cohort’s larger names — the incremental shorting this month was not. Bears added selectively on top of a broad, established base.
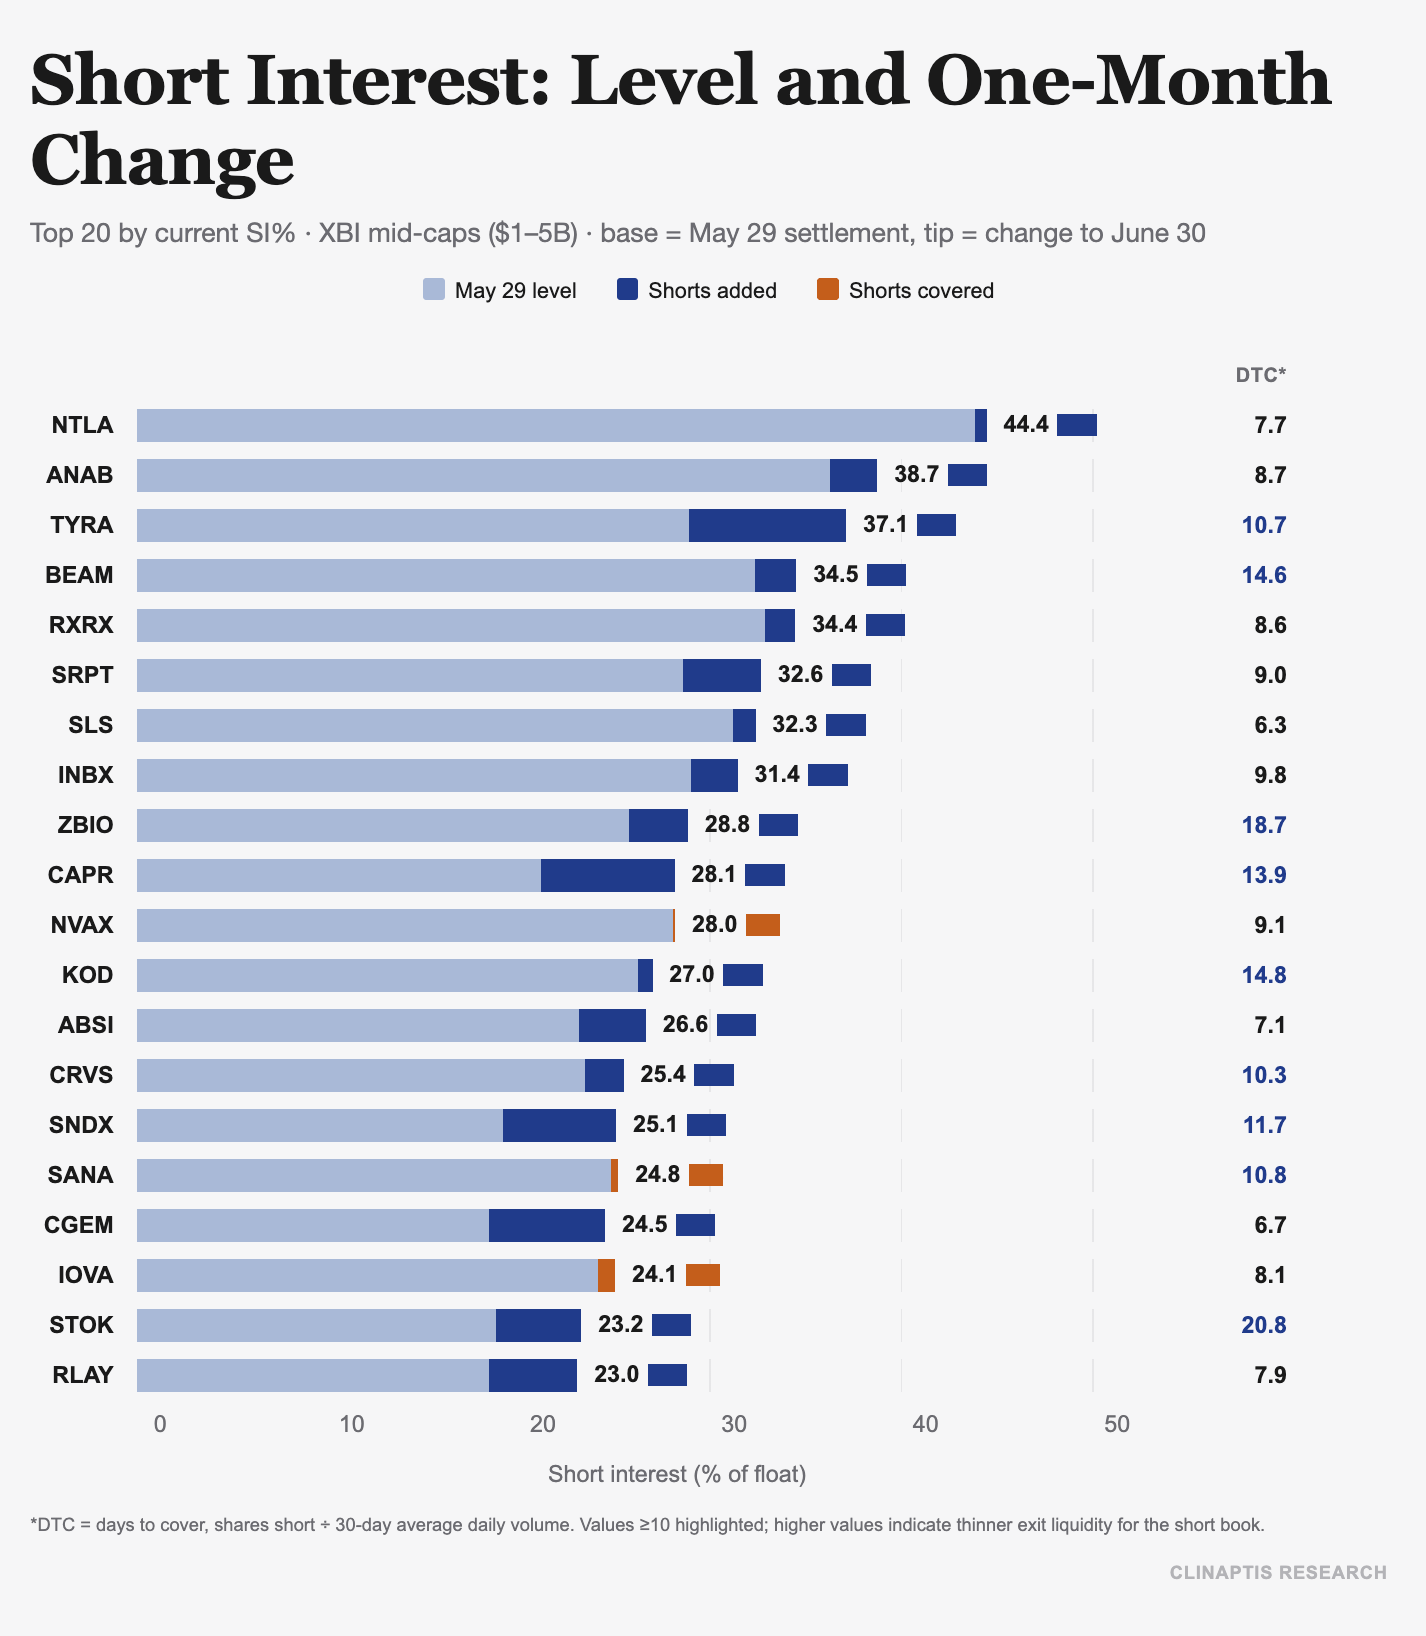
The crowded book is a book of duration and belief. The top of the level ranking is not a collection of distressed balance sheets. It is a roster of controversial platforms and development-stage clinical stories. Genetic-medicine names anchor the peak — NTLA at 44% of float, BEAM at 35% — with AI-enabled discovery platforms (RXRX, ABSI) and precision oncology (TYRA, SNDX) close behind. The market is not shorting insolvency; it is shorting duration and belief — long-dated cash burn, binary readouts and premium valuations attached to technologies whose commercial economics remain unproven. Commercial, cash-generative biotech is conspicuously absent from this list, which tells you where the Street’s skepticism actually lives.
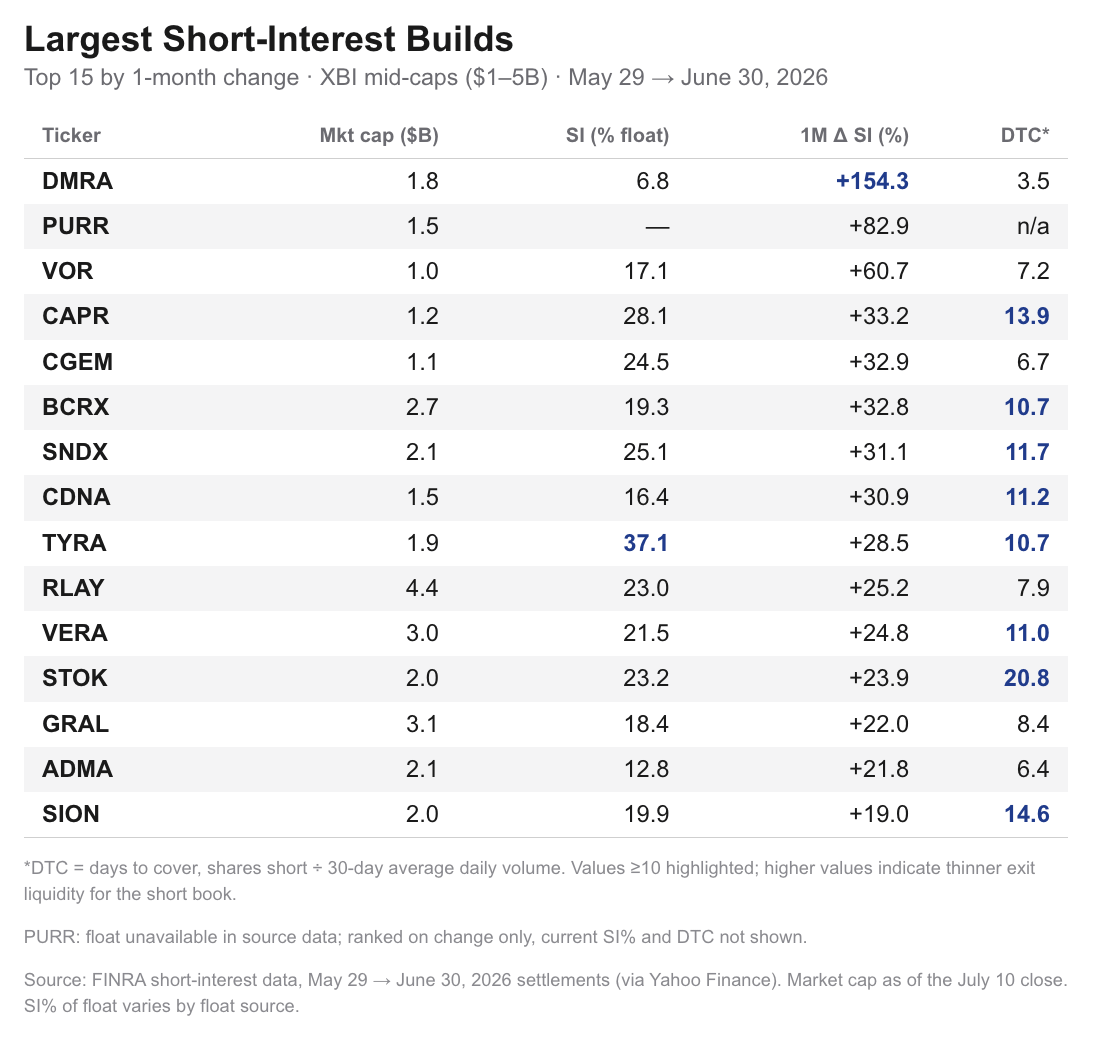
Where the flow went — and why. Current SI% tells you where shorts already sit; the change tells you where they are moving, and the two lists barely overlap. The largest builds such as — Damora (DMRA), Vor (VOR), CareDx (CDNA), Grail (GRAL), ADMA Biologics (ADMA) — began the month lightly shorted and remain below the cohort median even after a sharp increase. These are theses in formation, not theses being pressed. DMRA is the cleanest example of the archetype: the stock has run ~7x on the mutant-CALR mAb rebranding despite the lead asset (DMR-001) not yet in the clinic — IND submission is mid-2026, Ph1 POC data not expected until 2027 — and specialist ownership has clustered tightly (multiple specialist funds converging in Q2). That is a valuation-momentum short in a catalyst vacuum. GRAL is a different structure — a deferred-cash-flow short against a ~$320M annual burn, with Medicare MCED coverage authorized in February but not effective until 2028. ADMA sits in a third category and should be read that way: a commercial-stage IG franchise where the short is about plasma cost, pricing, and channel dynamics rather than a clinical binary. The key distinction within emerging shorts is simple: is the market shorting an upcoming clinical catalyst, or a deteriorating commercial story?
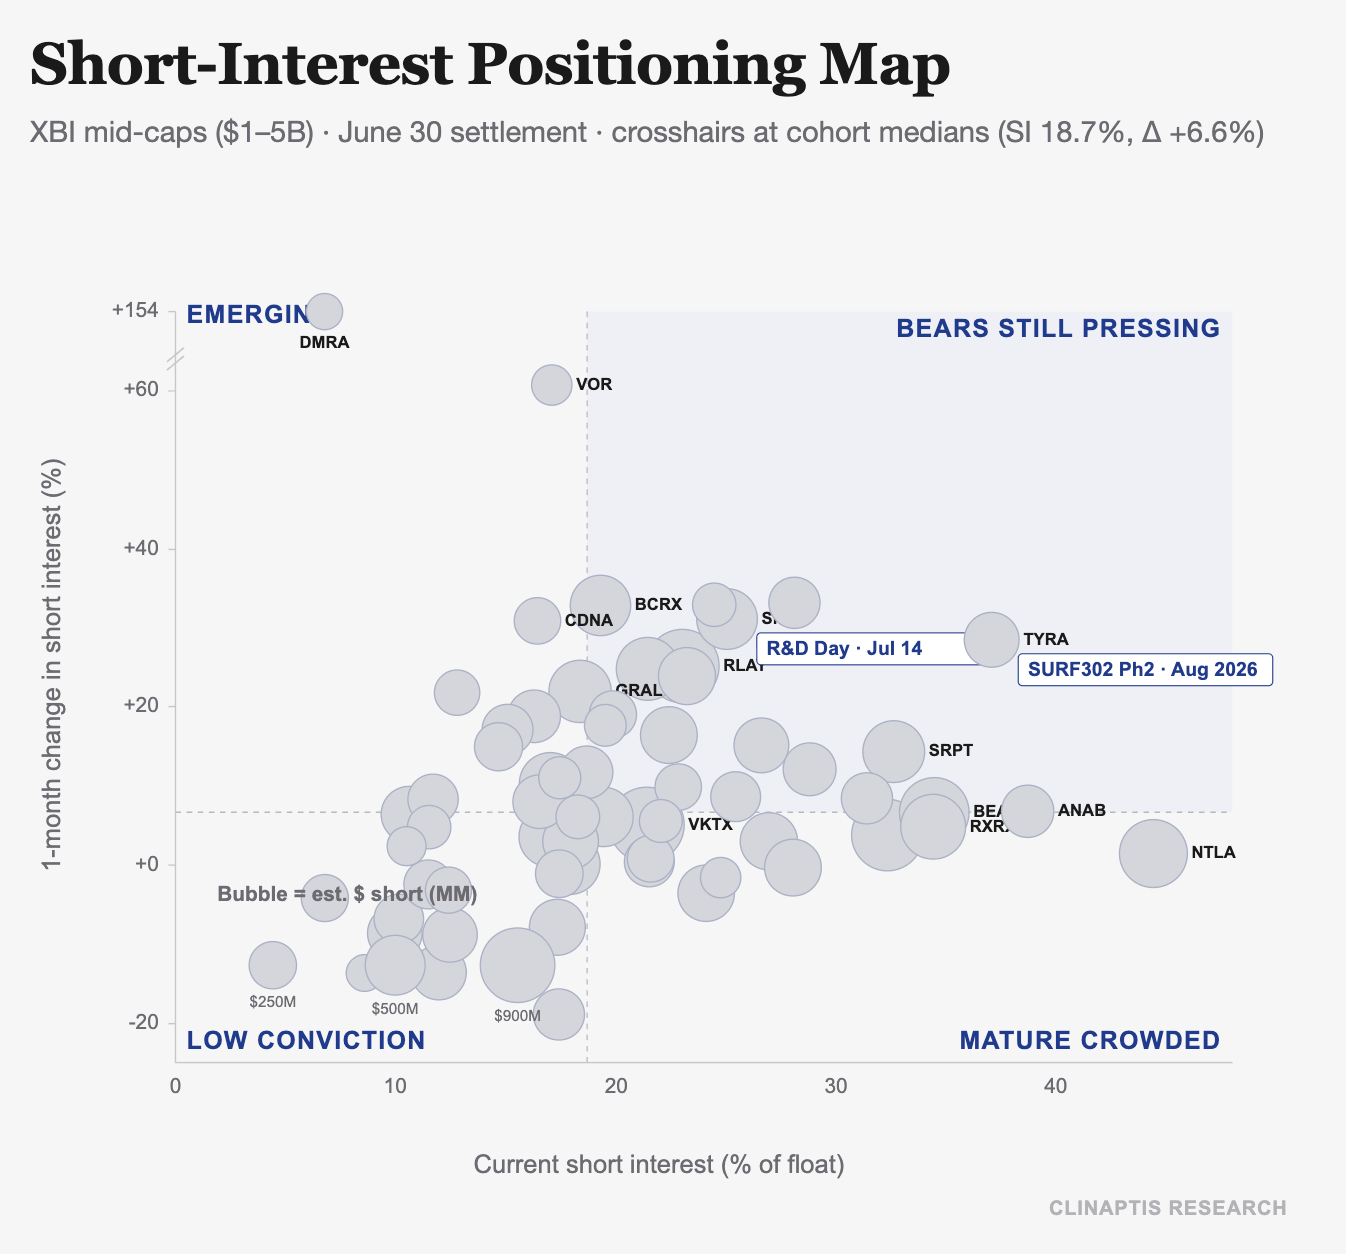
Only two names sit in both the crowding and the flow tables in force: TYRA and SNDX — the two occupants of the Bears-Still-Pressing quadrant. Those are where conviction and momentum agree. (*PURR carries a missing float value in the source data and can be ranked on flow but not on level until supplemented.)
The catalyst overlay makes the quadrant tradable. TYRA is the third-most-crowded name in the cohort (37% of float) and among the fastest-growing shorts (+28% M/M), with initial three-month CR data from the SURF302 Ph2 in IR NMIBC due in Aug 2026 (oral FGFR3 dabogratinib, n>20 enrolled) and cash into 2H28 — so this is a clean clinical binary, not a financing setup, and the marginal short is still arriving into it. SNDX (25% of float, +31% M/M) frames as two overlapping stories: a July 14 R&D Day, Ph2 Niktimvo topline in frontline cGVHD and IPF in 4Q, and — the deeper structural leg — the KURA/ziftomenib menin-inhibitor competitive overhang against Revuforj’s early launch. That is why a two-name quadrant is worth the disproportionate attention: it is n=2, but it is the right n=2, and each has a dated catalyst attached to real, still-arriving short capital.
The dollar-exposure table asks a different question. VKTX leads the cohort in committed short capital at ~$907M despite a middling 21% of float — the position is large because the company is large, not because it is crowded. The same logic elevates RLAY, VERA, GRAL, RARE, DYN — none of which crack the crowding table but each of which carries half a billion dollars or more of bearish capital. Percentage-of-float measures the risk of a squeeze; dollar exposure measures where real money is actually committed. They answer different questions and often name different stocks.
What it means: a positioning map, not a leaderboard. The catalyst framework follows from the map rather than from a blanket squeeze warning. High-and-rising SI into an approaching binary is the genuinely asymmetric setup — TYRA the cleanest example, SNDX the second. Contrast with NTLA, comparably crowded but essentially flat this month: a mature short where positive data would surprise a market that has already fully expressed its skepticism, but where the incremental-positioning tailwind for bears has stalled. And a third category — large dollar exposure at moderate SI%, as with VKTX and RLAY — carries meaningful capital risk that a float-based screen would miss entirely. The distinctions matter because they separate names where a positive print merely relieves pressure from names where it could force a disorderly unwind.
The core read for the month returns to the opening the standard screens are reading this tape backwards on both counts. Rising SI is not either broadening or concentration — it is both stacked. And high SI% is not a squeeze risk when the most-crowded names are the ones where positioning has already exhausted itself; the top of the list has stalled, not intensified. The actionable set is small and specific: names that are crowded and still building into a dated catalyst (TYRA and SNDX), and the emerging shorts forming from low bases — separated into clinical-anticipation shorts (DMRA, VOR, CDNA) and commercial-execution shorts (GRAL, ADMA) because they trade differently. That gap — between what the level says and what the change says, and between what the change means for a preclinical name and what it means for a commercial one — is the edge this monitor exists to track, settlement by settlement.
Benchmark: how the large-cap pharma tape reads
The SMID read means little without a reference point, and large-cap pharma provides the cleanest one — not because it belongs in the same analytical bucket, but because it shows how differently capital positions itself across the ecosystem’s stages. The contrast is the point.
Large Caps. Three structural facts separate large-cap pharma from SMID biotech. The most-crowded name - REGN at 3.5% of float — would sit in the bottom decile of the SMID cohort, where the median is ~19%. Days-to-cover confirms the gap: the highest reading here is Amgen (AMGN) at ~4 days against the routine 10-to-20+ in SMID, so even rising bearish interest exits trivially. And incremental positioning is selective rather than directional — most names moved within ±0.2pp of float, consistent with single-name expression, not a broad tilt against the group. Large-cap pharma is not unshortable — pair trades and thematic shorts run through these names constantly — but it is where healthcare capital expresses selective single-name views, not where it accumulates directional books.
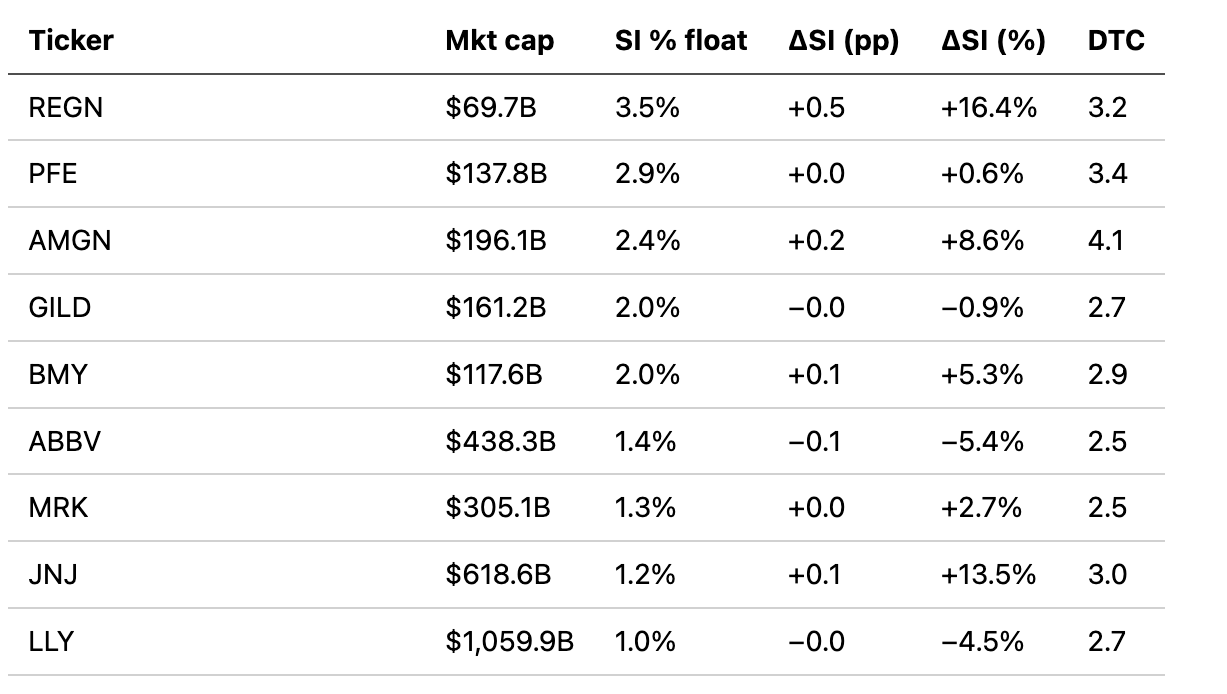
REGN is an exception worth watching. It carries the highest SI, the largest absolute build (+0.5pp) and a +16% M/M Δ — unusual for a profitable large-cap. The build is anchored in real erosion, not sentiment: Eylea US sales were $473M in Q1 2026, down 36% Y/Y as multiple US biosimilars enter. Eylea HD ran $468M, up 52% Y/Y but down 7% sequentially — cannibalization is now real. Dupixent’s trajectory is the offsetting bull leg. This is a franchise-decay short on a cash-generative name — a different animal from the burn-and-binary shorts that dominate SMID — which is why it merits closer monitoring.
Two cautions on the rest. The eye-catching moves — GlaxoSmithKline (GSK) +30.6%, Novo Nordisk (NVO) +22.5%, Novartis (NVS) +17.9% — are low-base artifacts: each begins below 1% of float, so a trivial absolute change reads as dramatic. More fundamentally, the European names appear only as US-listed ADRs, whose SI captures the ADR tranche and understates positioning against the primary listing; true European SI runs through national regulators rather than a FINRA-style aggregate. We show the ADRs for completeness but exclude them from cross-name comparison. NVO’s ~$219B cap already embeds a sharp FY25 derating on oral-obesity competition; its minimal ADR short is a measurement floor, not a signal of conviction.
The takeaway for positioning. Bearish capital in healthcare concentrates by design in development-stage biotech, where catalysts are binary and floats are thin. Mature pharma is where funds express selective single-name views — not where they crowd. The SMID monitor is where the pressure actually builds; the large-cap benchmark is where you calibrate whether the pressure is doing anything.
Where this monitor falls short. Days-to-cover (DTC) across the SMID cohort, borrow-cost tiering for the crowded and emerging buckets, and a directional-vs-structural flag distinguishing genuine short theses from convertible arb, ATM overhang, and index-driven borrow demand — these are the three additions that would let the Bears-Still-Pressing quadrant translate cleanly into position sizing.
Clinaptis Monthly Biotech Short Monitor tracks the evolution of bearish positioning across SMID biotechnology. The edge is not the FINRA file, which everyone receives; it is the interpretation, published before the read goes stale. Estimated dollar figures use shares short × implied share price and are approximate. SI% varies by float source and should be verified per name before use as a precise figure.
Disclaimer
This note is published by Clinaptis for informational and educational purposes only. Nothing herein constitutes investment advice or a recommendation to buy or sell any security. Clinaptis is not a registered investment advisor or licensed financial professional. All data referenced is sourced from publicly available company filings, clinical trial publications, peer-reviewed literature, and regulatory disclosures. Clinaptis may hold positions in securities discussed.