
DYN is down 36.6% from its 4 September close. At $15.40, we estimate the price assigns $1.5B to DM1 against roughly 41% odds of a statistical REC win—leaving little room for a win that falls short of the full-success case.
Novartis’ failure has made Dyne cheaper. Whether it has made Dyne cheap is another matter. On 8 Sep, Novartis said its Phase 3 HARBOR trial missed its primary endpoint, video hand opening time (vHOT), in myotonic dystrophy type 1 (DM1) without disclosing the effect estimate. DYN sold off in sympathy as investors treated the HARBOR miss as a negative read-through to its own vHOT trial, losing about $705M in XBI-adjusted market value that day. One month later, shares are still down ~36%. Dyne’s z-basivarsen will face a vHOT test of its own in the ACHIEVE registrational expansion cohort (REC), with results expected in Q1 2027.
The REC must show that DM1 patients can open their hands faster. A statistical win would still leave a second question: whether FDA accepts the observed vHOT effect as a surrogate clinical endpoint for accelerated approval. Dyne’s Phase 3 HARMONIA trial then has to establish functional benefit on a different primary endpoint called five-times sit-to-stand (FTSST). The randomized evidence behind the REC dose includes a vHOT contrast from n=6 treated patients in Phase 1/2 ACHIEVE. NVS’ HARBOR weakens confidence in that small signal, but its undisclosed effect size cannot tell us how much of the failure belongs to Novartis’ drug and how much to the endpoint or treatment approach.
At $15.40, the price leaves little room for an inconclusive REC win. We estimate a 38–51% chance of meeting the vHOT primary endpoint, centered near 41%. Management’s roughly 90% power calculation uses ACHIEVE’s unshrunk 3.3-second effect. After assigning value to the Duchenne muscular dystrophy (DMD) program and the platform, we estimate that the price still attributes $1.5B to DM1. Consider a stark valuation test: give every statistical REC win our full $4.0B DM1 value and every miss zero. At 41% odds, that yields $1.64B—just $140M above the market’s implied DM1 value. A positive p-value alone would not secure that full-success case. The size of the vHOT effect—and whether the functional measures move with it—will determine how much of that $4.0B case a REC win can support.
Investment view. We make no directional call on the REC readout. Our modeled miss case is $7.50 a share (−51% from $15.40); a strong win yields $24–29 (+56–88%). These are DM1-led scenarios, while Dyne’s DMD program has a nearer catalyst: its 21 January 2027 FDA decision. We have not independently underwritten DMD or FDA’s eventual judgment of vHOT.
1. HARBOR pulls the expected REC effect toward 2 seconds
Our scenario weights put the REC effect at 2.03 seconds, roughly two-fifths below ACHIEVE’s 3.3-second estimate. The weights are judgments: HARBOR missed, but Novartis disclosed too little to tell us why.
ACHIEVE’s 3.3-second placebo-adjusted vHOT improvement at the REC dose comes from six treated patients. Its 95% interval spans a 7.8-second improvement to a 1.2-second worsening (p≈0.14). That range is more useful than the p-value. Even before HARBOR, a favorable estimate from such a small group, selected to guide further development, warranted shrinkage.
Dyne’s pooled 3.6-second result (p≈0.004) adds observations but does not independently replicate the REC regimen. It combines doses and re-baselines former placebo patients before adding them to the treated group. Up to eight of the 14 placebo patients may thus contribute observations to both sides of the comparison. The disclosed analysis does not let us determine how much this overlap affects precision.
HARBOR provides a negative result, not an effect size. Novartis released no estimate, confidence interval or variance; its analysis model and α are redacted. A weak drug effect, excess noise or the choice of timepoint could each explain the miss. Yet the miss still updates the odds: with 159 patients randomized 1:1 and a 4.7-second change SD, it was about 25 times more likely under a true 1.5-second effect than a 3.0-second effect (Appendix, note 3). An amendment moved HARBOR’s primary assessment from Week 30 to Week 54 after enrollment closed. The reason is unknown, and Week 54 is an imperfect guide to Dyne’s Week 25 REC endpoint.
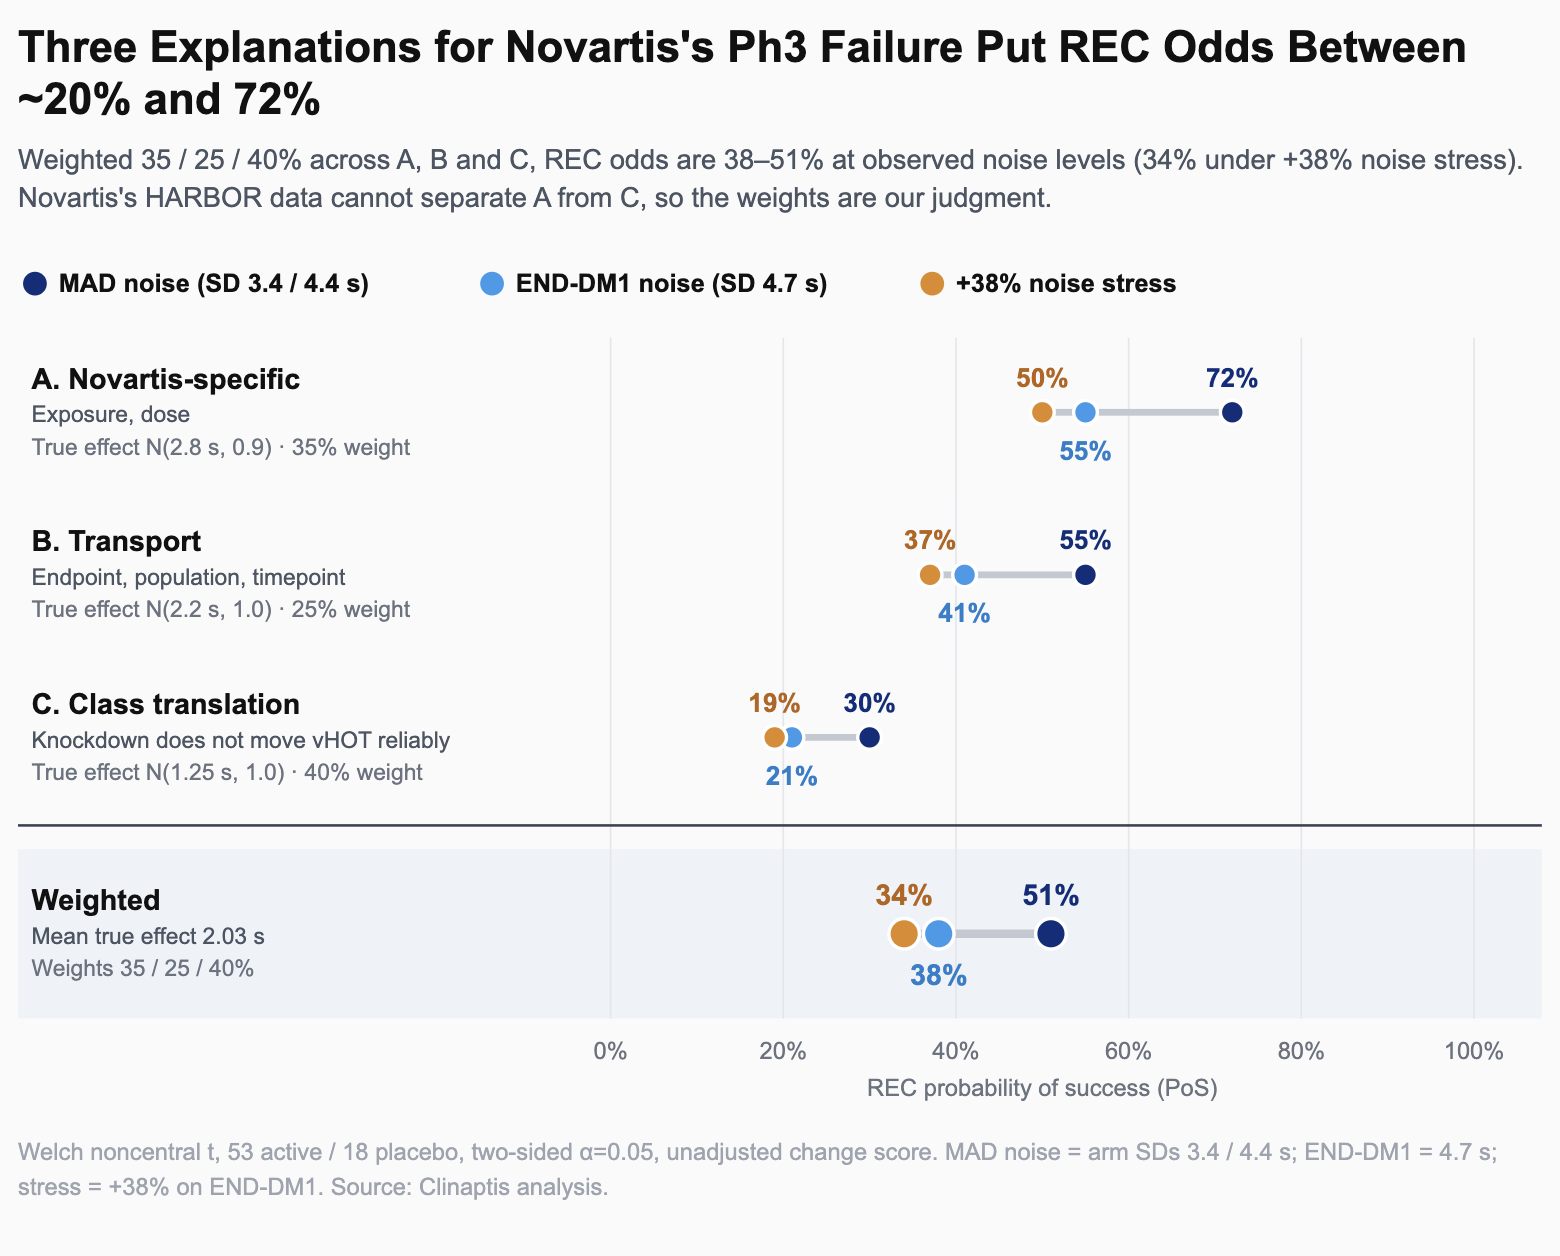
The three explanations carry different implications for Dyne:
 Open full resolution ↗
HARBOR cannot separate A from C; both could produce a weak result. We give C the largest weight, 40%, as a judgment rather than a formally identified probability. The resulting PoS figures should be read to the nearest five points.
C makes the strongest transfer assumption across drugs and trials: Novartis’ 4 mg/kg siRNA at Week 54 must inform Dyne’s 6.8 mg/kg ASO at Week 25. Under that assumption, we combine ACHIEVE’s six-patient estimate with MARINA’s exploratory randomized signal (12 treated, 8 placebo), then update on the HARBOR miss. The implied class effect is about 1.3 seconds, ranging from 0.8 to 1.7 seconds across plausible change SDs. MARINA and HARBOR tested the same compound, so the prior and update are not independent (Appendix, note 4). This calculation cannot establish that Dyne inherits the estimated class effect.
Weights of 35% for A, 25% for B and 40% for C give a mean REC effect of 2.03 seconds. C pulls the estimate toward 1.3 seconds; A preserves a tail near ACHIEVE’s result. The REC must contend with the full distribution.
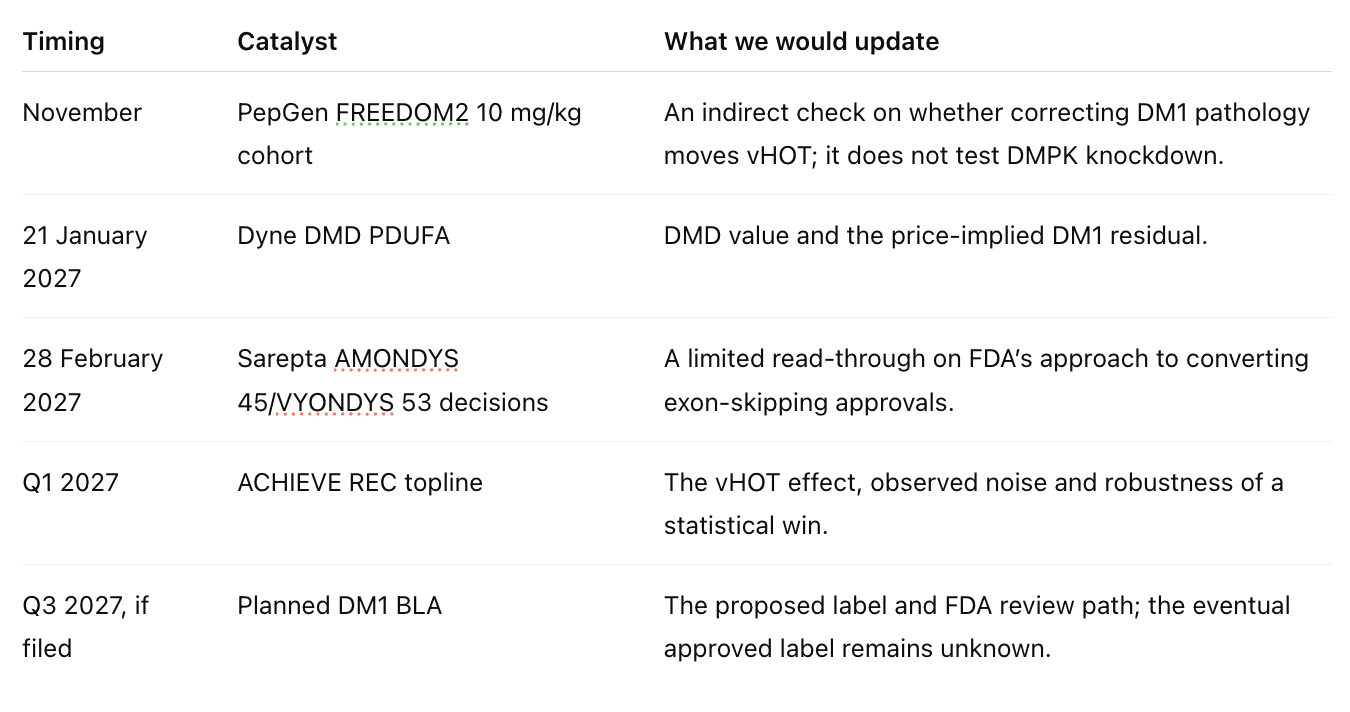
PepGen’s FREEDOM2 10 mg/kg cohort, guided for Nov, offers the nearest external check on vHOT. Its oligo releases MBNL from CUG repeats rather than knocking down DMPK. It may show whether vHOT moves when DM1 pathology is corrected, but cannot establish Dyne’s drug effect (§6).
2. At two seconds, noise can decide the REC
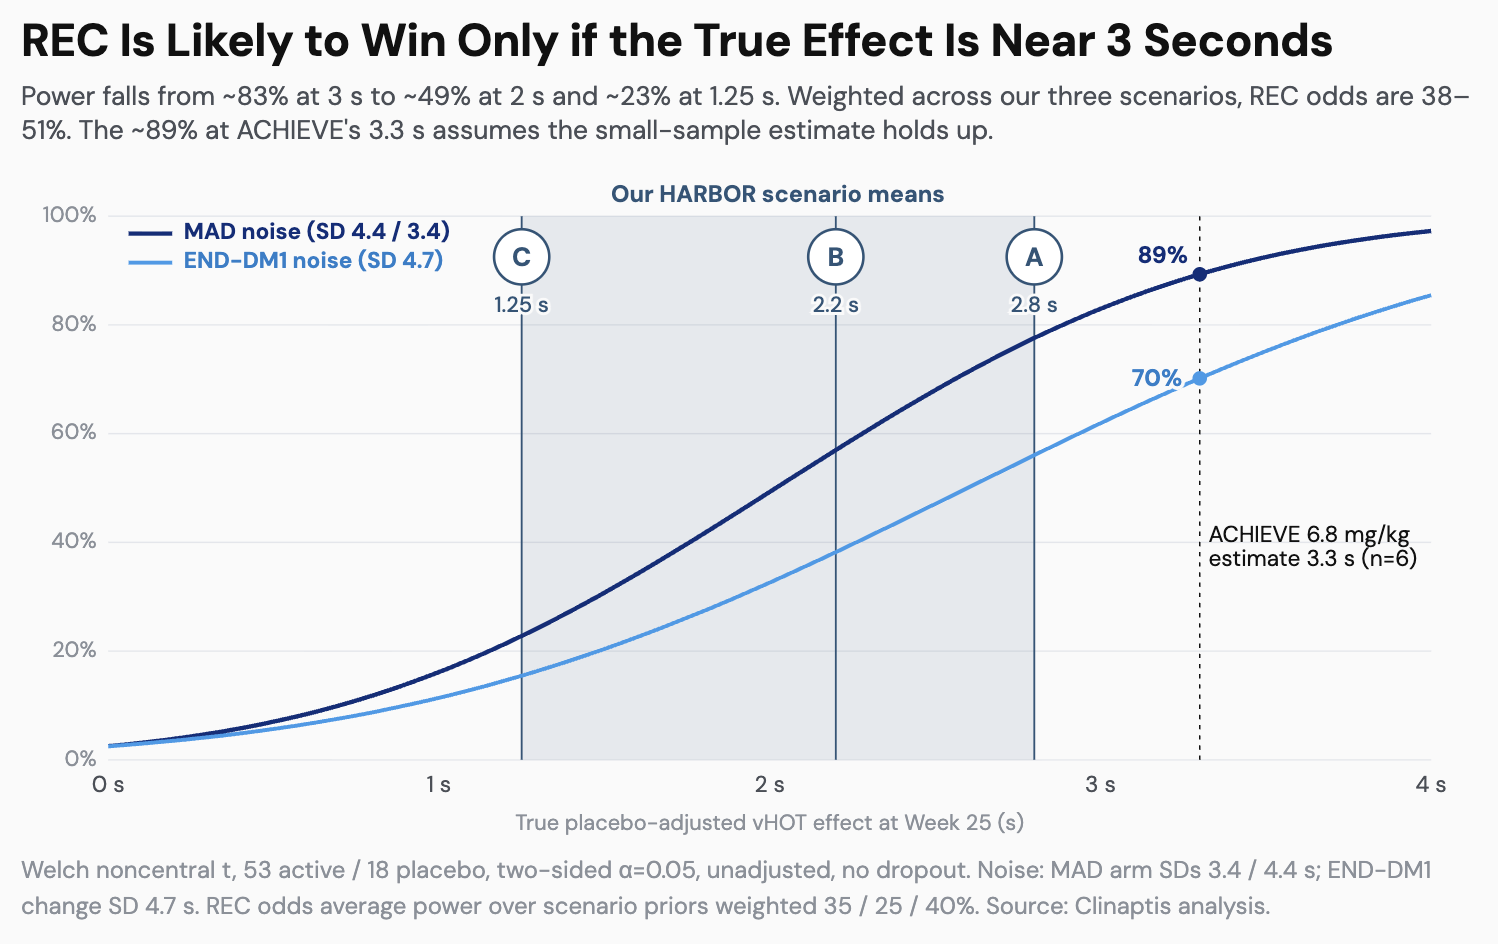
Our predictive probability of a statistical win is 38–51%, with roughly 41% as the working estimate. Management’s roughly 90% figure is power at ACHIEVE’s unshrunk 3.3-second effect; ours averages over the effect scenarios in §1.
The REC randomizes about 53 patients to z-basivarsen and 18 to placebo, with vHOT assessed at Week 25. Blinded baseline vHOT averages 8.3 seconds (SD 6.0). Using the change noise observed in ACHIEVE’s multiple ascending dose (MAD) arms—SDs of 4.4 seconds on treatment and 3.4 on placebo—we calculate 89% unadjusted power at a 3.3-second effect. That is consistent with management’s roughly 90%, although its assumptions are undisclosed. Power falls to 80% at about 2.9 seconds and approaches a coin flip at 2.0 seconds. Using END-DM1’s one-year change SD of 4.7 seconds instead, power at 3.3 seconds falls to about 70%.
 Open full resolution ↗
Which noise estimate belongs in the REC is unresolved. Its baseline vHOT spread is roughly 1.6–2 times that of the MAD arms, but baseline variation does not translate directly into change variation. Across the available studies, change SDs are 3.4–4.7 seconds despite baseline SDs of 3.0–8.4 seconds. END-DM1 does not report change SD by baseline severity.
A reliability check tilts us toward the higher-noise case. If vHOT spread at six months resembles baseline and the within-patient correlation is no higher than the roughly 0.7 test–retest reliability, change SD is unlikely to fall much below 4.6 seconds (Appendix, note 2). Neither premise can be tested before topline. We therefore treat END-DM1-like noise as more plausible, while retaining MAD noise as the favorable end of the range.
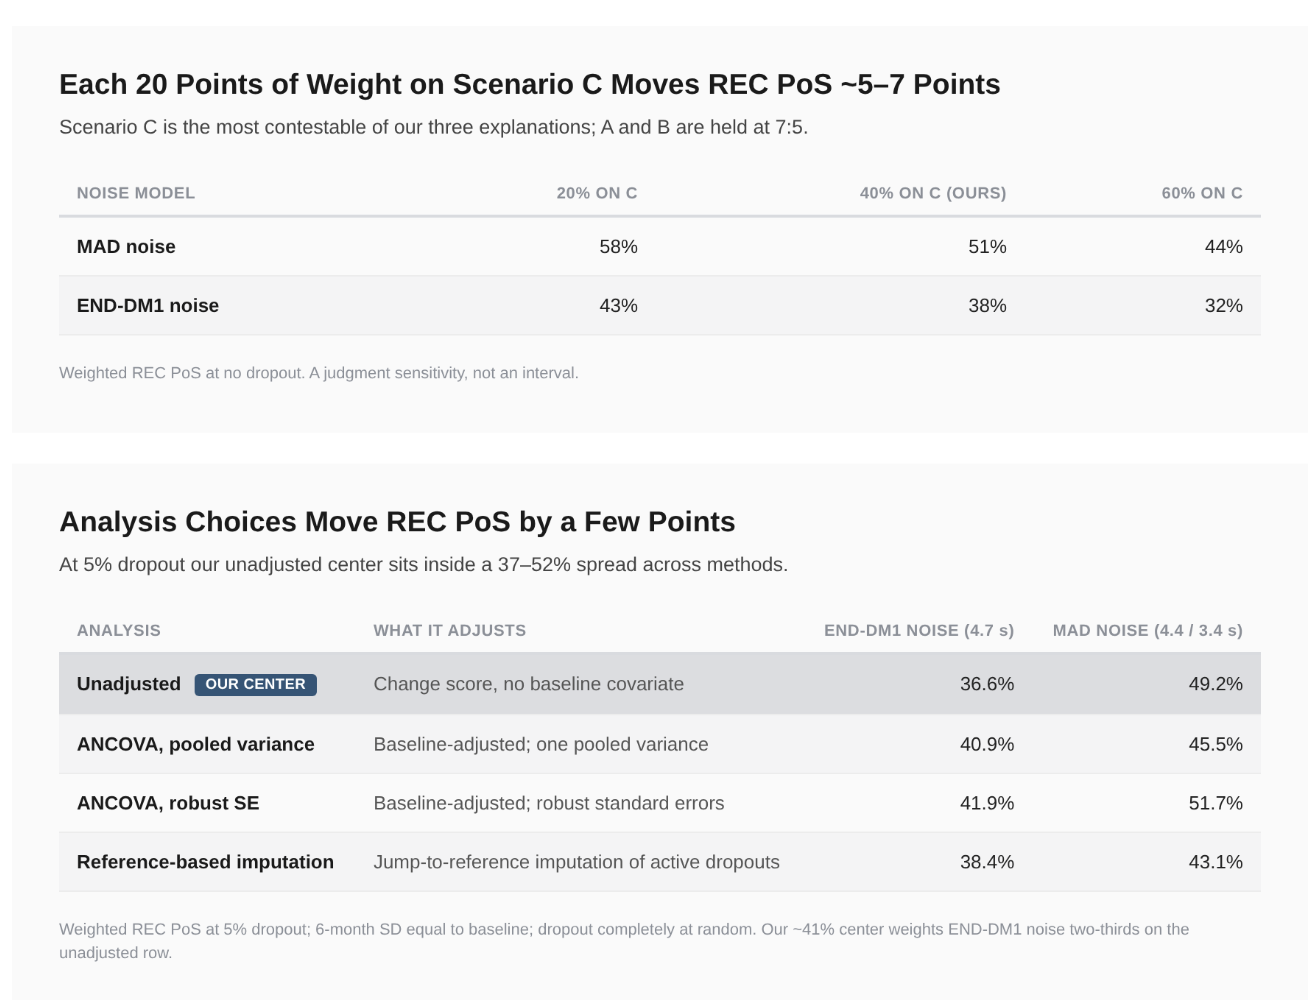
Integrating the §1 effect scenarios yields 51% PoS at MAD noise and 38% at END-DM1 noise. Near this range, each additional second of change SD costs roughly 12 percentage points; a 38% noise stress lowers PoS to 34%. Changing scenario C’s weight from 40% to 20% or 60% moves PoS by about 5–7 points in either direction. These are sensitivities to assumptions, not confidence intervals (Appendix, note 5).
A patient-level simulation provides a check. It allows uneven responses, a floor on vHOT and noise that increases with the REC’s wider baseline spread; we retain versions consistent with ACHIEVE’s verified active-arm change SD of 3.5 seconds. At 5% dropout, PoS ranges from about 38% to 48%, averaging 45%. We keep roughly 41% as the headline estimate: the four-point difference is smaller than the uncertainty in the model inputs. The 45% case and its valuation implication belong in the §5 sensitivity analysis (Appendix, note 10).
The REC analysis plan could matter more than routine modeling choices. Dyne has not disclosed its model, covariates, analysis population, missing-data rules or multiplicity approach. Robust baseline adjustment raises simulated PoS to ~45%, while plausible plans span roughly 40–45%. At 10–20% dropout, imputing active-arm dropouts as placebo lowers PoS by about 6–17 points. If poor responders disproportionately leave treatment, nominal significance could instead improve while interpretation of the result becomes harder (Appendix, note 6).
On our assumptions, the REC is much closer to a coin flip than management’s headline power suggests. The effect achieved, the observed noise and the handling of missing patients will determine which side of that line it lands on.
3. The size of a REC win matters as much as the p-value
Our roughly 41% PoS counts every statistical win. It does not tell us how many wins will be large and robust enough to support accelerated approval—or retain the value of our full-success case.
We grade a win by its effect size, confidence interval and supporting data. In our unadjusted 53-versus-18 model, a strong result has a 95% confidence interval excluding a 1-second effect. That takes an observed improvement of roughly 3.0 seconds at MAD noise or 3.6 seconds at END-DM1 noise. Arm change SDs at or below about 4.7 seconds and functional secondaries moving in the same direction would strengthen the case. FDA would still have to accept the observed vHOT effect as an intermediate clinical endpoint and determine the label.
A marginal win could be statistically significant at roughly 2.0–2.6 seconds while its interval still includes a 1-second effect. Its interpretation would depend more heavily on missing-data treatment, reference-based and tipping-point analyses, and whether FDA considers the effect reasonably likely to predict clinical benefit. These numerical thresholds will move with the REC’s actual sample, SD and analysis plan.
FDA has not publicly set an acceptable vHOT effect size. Following a May 2025 Type C meeting, Dyne and FDA agreed that the next step was to submit a revised REC protocol for review, with vHOT proposed as the primary intermediate clinical endpoint. That was not an advance determination that any statistically significant effect would support approval. Dyne’s current guidance places a potential BLA submission in Q3 2027, about three quarters later than its June 2025 plan; the change supplies no evidence of FDA’s eventual judgment.
Omaveloxolone offers a procedural example, not a vHOT precedent. FDA approved it in Friedreich ataxia (FA) on the modest, prespecified MOXIe result (mFARS −2.41; p=0.0138), supported by a fixed analysis plan and missing-data sensitivities. We didn’t review FDA’s statistical assessment of that application for this note (Appendix, note 7).
We apply no safety haircut at this stage. Among 56 MAD participants, the 10 serious treatment-emergent adverse events (TEAE) in eight patients were judged unrelated to drug, with no persistent related anemia or thrombocytopenia. Infusion reactions were the most common AEs (50%) and led to 2 withdrawals, so tolerability could still shape use or labeling. REC’s safety remains blinded.
HARMONIA tests functional benefit on five-times sit-to-stand for US confirmation and applications outside the US. Dosing began in July 2026, positioning it for FDA’s potential requirement that a confirmatory trial be underway before accelerated approval. The registry’s July 2028 primary completion date is an estimate, not a readout or FDA-action date. HARMONIA’s different endpoint may also leave a route forward after a REC miss (§6).
4. Uptake drives our $4.0B unrisked DM1 NPV
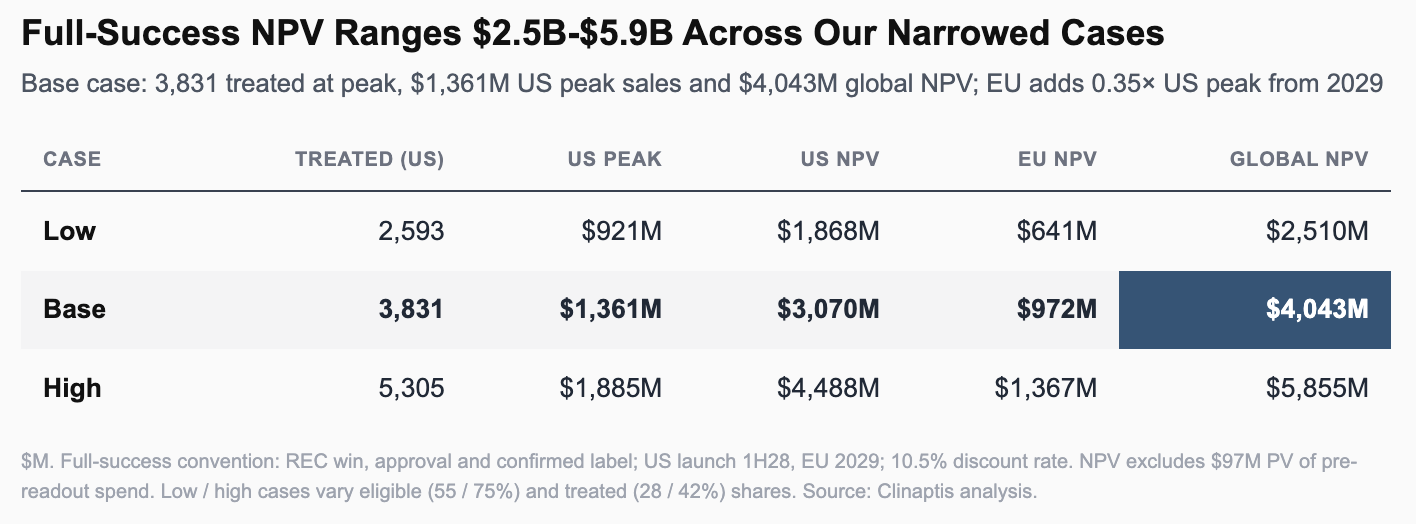
The $4.0B base assumes a REC win, approval, a confirmed label and launches in the US in 2028 and Europe in 2029. Treated share is the largest sensitivity and has the least direct DM1 evidence.
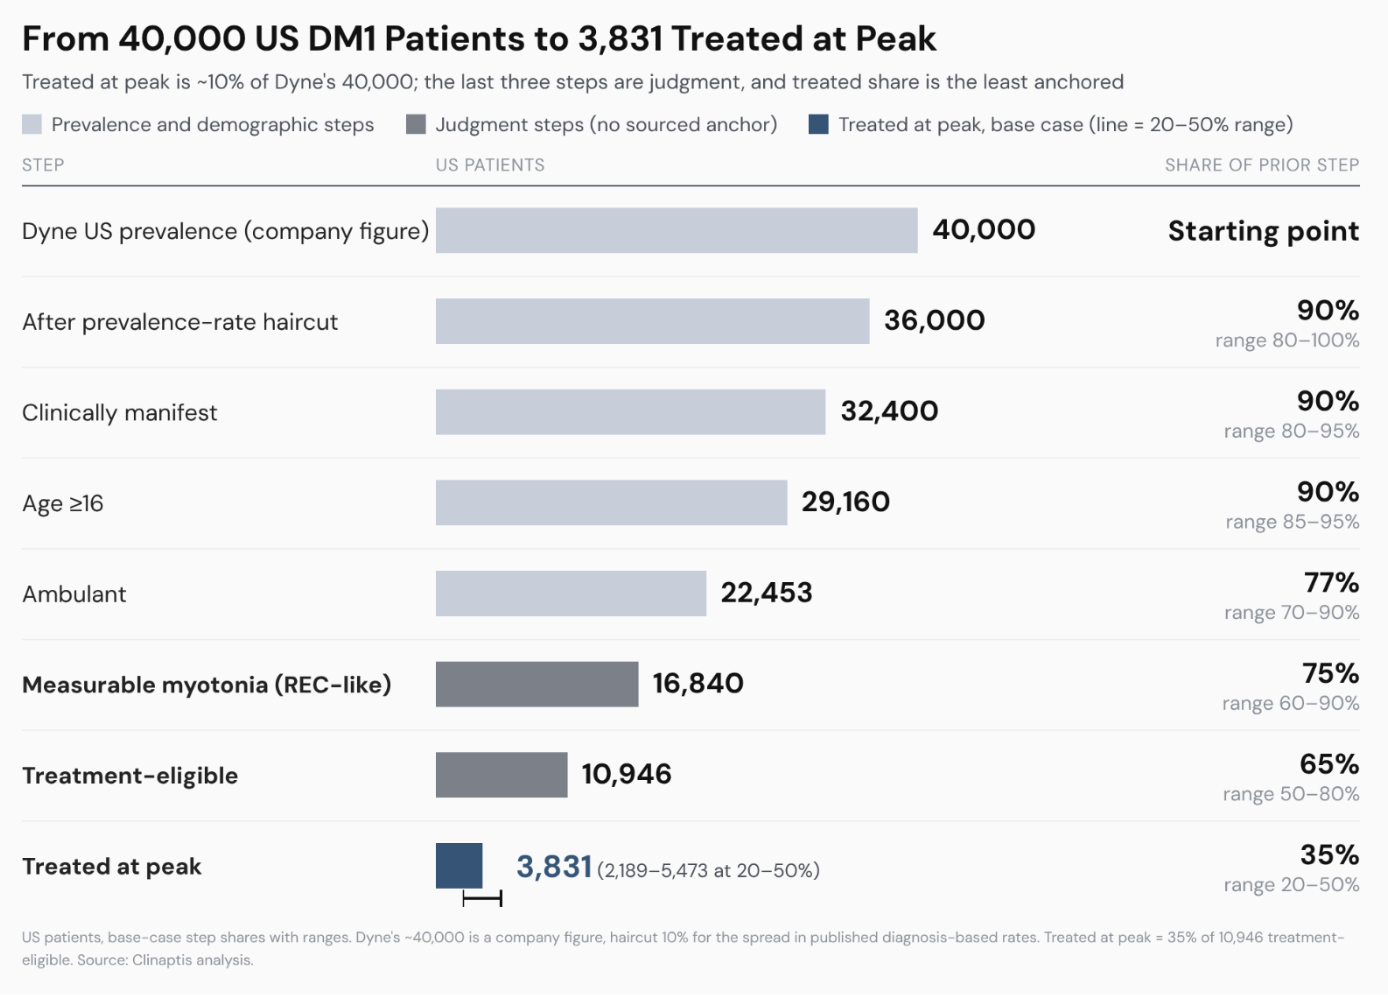
We treat Dyne’s estimate of more than 40,000 US patients as a diagnosed population and apply a 10% prevalence haircut. Our funnel leaves about 10,900 treatment-eligible patients. Treating 35% at peak yields 3,831 patients and $1.36B in US peak sales (Appendix, note 8). The myotonia, eligibility and uptake shares are modeling assumptions, without direct DM1 estimates.
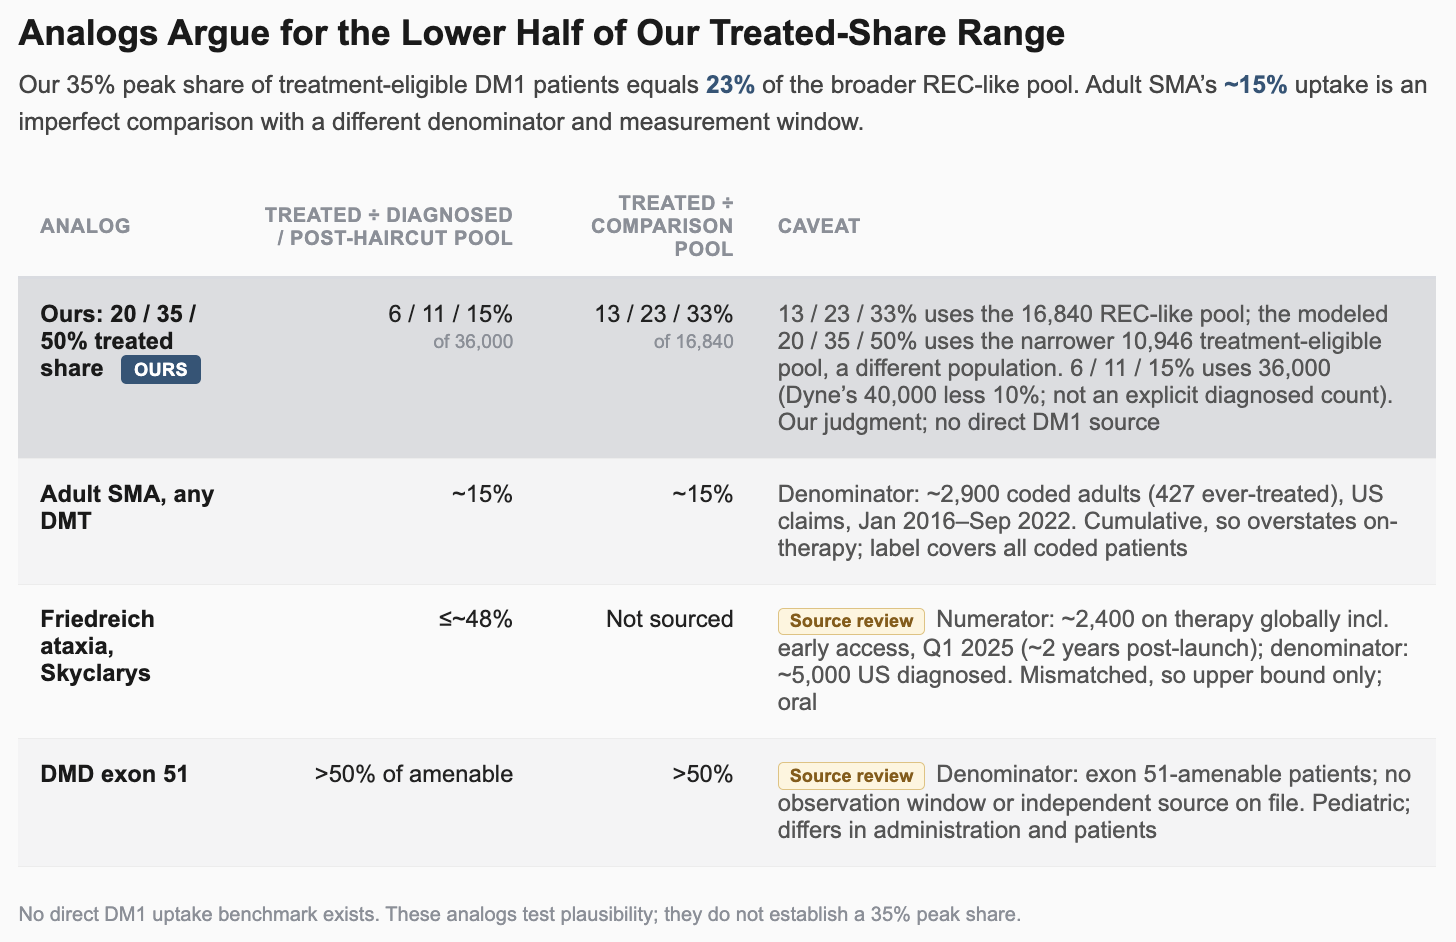
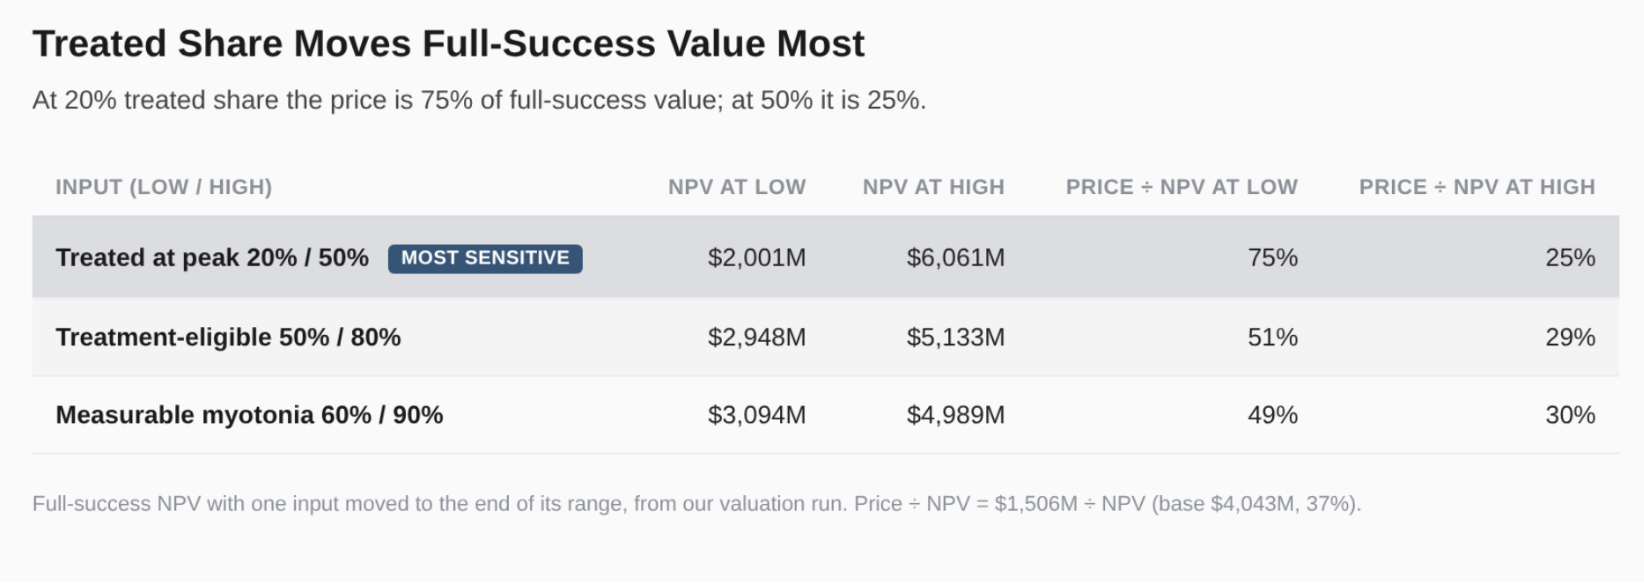
Moving treated share from 20% to 50%, with other inputs fixed, shifts unrisked NPV from about $2.0B to $6.1B (Appendix, note 13). Adult SMA offers the closest, imperfect check: its roughly 15% ever-treated rate among label-eligible adults falls below our 23% base on that broader denominator (35% treated × 65% eligible). It is a cumulative measure taken during launch, while differences in disease and administration limit the comparison. Friedreich ataxia provides a less comparable upper bound (Appendix, note 8). We retain 35% as the midpoint of our uptake range, though it looks generous against adult SMA.
Our $475,000 list price implies $418,000 net after discounts and about $355,000 in annual sales per treated patient after compliance. ICER’s orphan launch medians of $333,000–515,000 provide a broad price check, not a DM1 benchmark. Europe is less anchored: sales at 0.35× US peak contribute $972M, or 24% of base NPV. Removing Europe cuts value by that amount; an illustrative HARMONIA-failure case cuts at least half (Appendix, note 9).
 Open full resolution ↗
5. The price leaves little room for an imperfect REC win
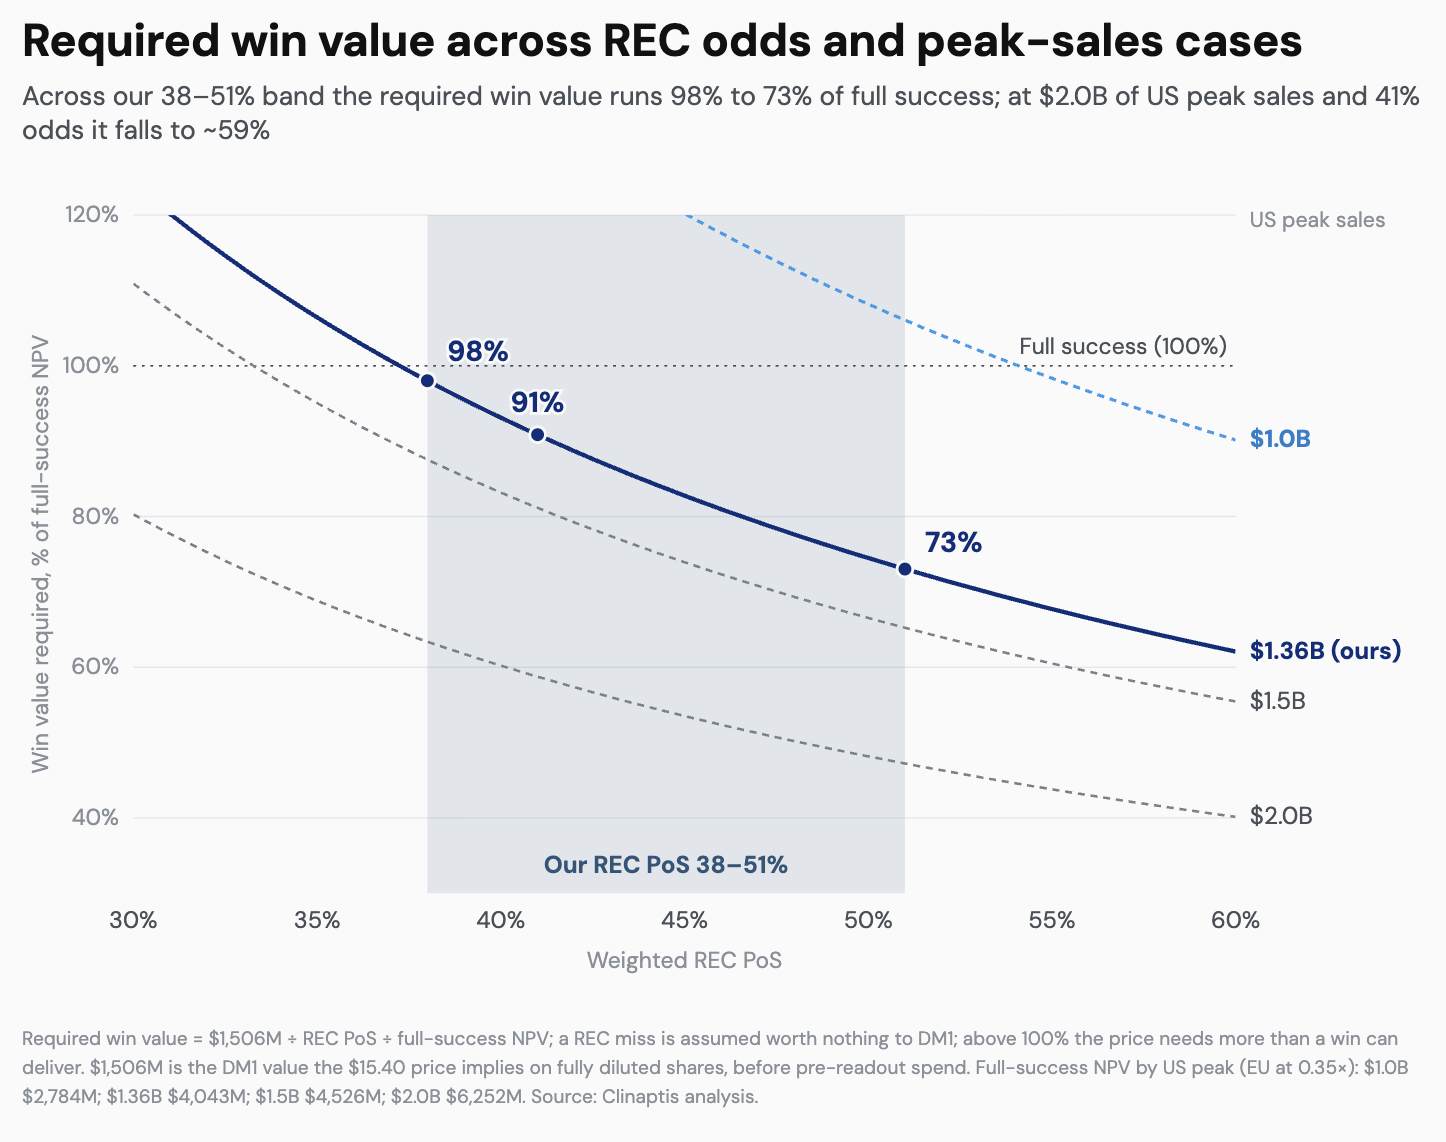
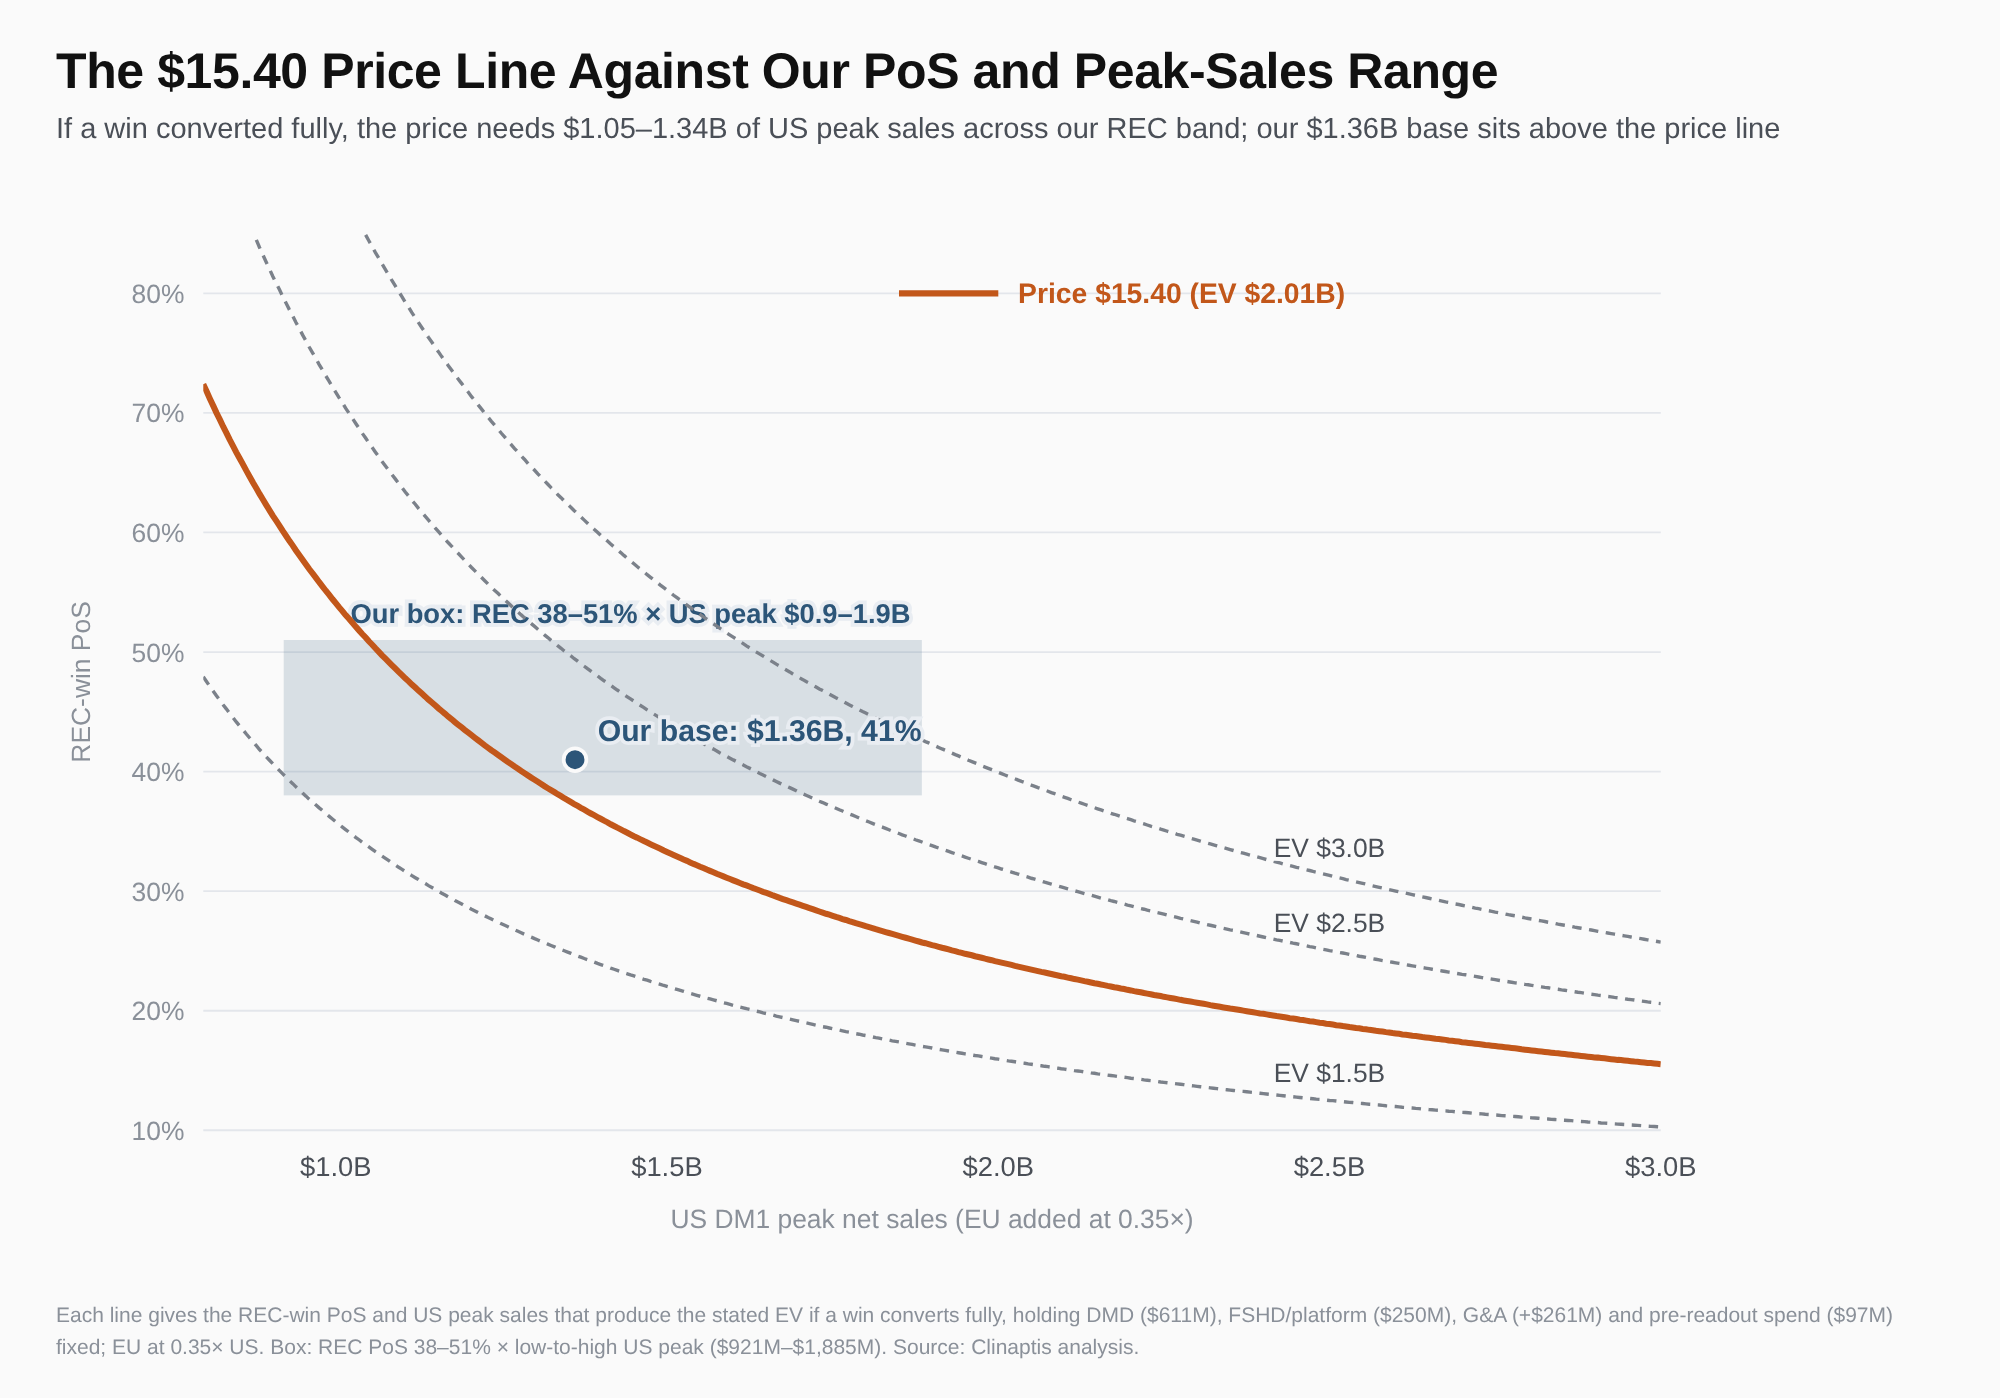
We estimate that DYN’s price assigns $1.51B to DM1, about 37% of our $4.04B unrisked NPV. At 41% odds of a statistical REC win and zero DM1 value after a miss, a win must retain 91% of that NPV to justify the allocation. Across our 38–51% probability range, the hurdle runs from 98% to 73%.
From share price to DM1 value
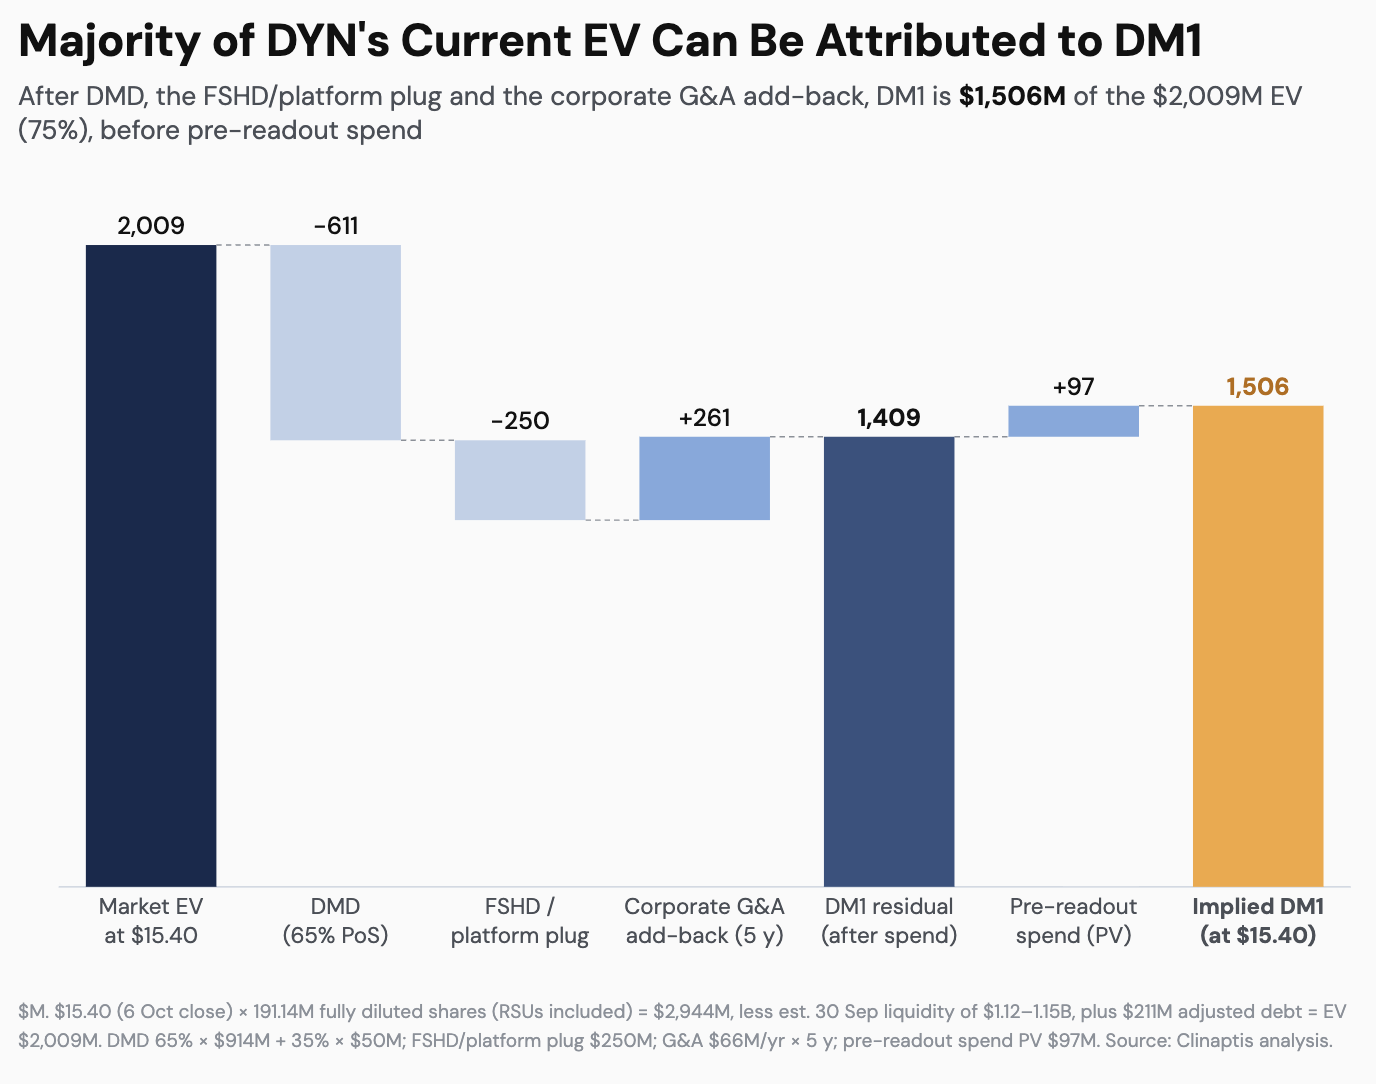
At the 6 October close of $15.40, 191.14M fully diluted shares give a $2.94B market capitalization. Subtracting estimated 30 September liquidity of $1.12–1.15B and adding $211M of adjusted debt produces $2.01B of enterprise value. The bridge and per-share cases use the same share count.
We allocate $611M to z-rostudirsen in DMD: a 65% probability of its $914M approval value and 35% of a $50M post-CRL value. The approval case discounts cash flows after FORZETTO’s expected 2030 primary completion by 20% for conversion risk. FSHD and the platform receive $250M (Appendix, DMD).
Product NPVs exclude corporate overhead that enterprise value bears. We therefore add back $261M, the present value of five years of overhead modeled at $66M annually. The higher Q2 2026 run rate includes DMD launch preparation; DMD cash flows already carry a $50M annual commercial floor from 2027. The resulting DM1 residual is $1,409M. Adding back $97M of pre-readout spending, which our unrisked DM1 NPV excludes, puts the price-implied DM1 value at $1,506M on a comparable basis.
 Open full resolution ↗
What the 91% hurdle says
Dividing $1,506M by 41% REC odds gives a required value of $3.67B after a win, versus our $4.04B unrisked DM1 NPV. The ratio is a break-even valuation hurdle under the zero-on-miss assumption. It is neither an approval probability nor a forecast of what a positive REC result will be worth.
 Open full resolution ↗
At the base odds, assigning every statistical win the entire $4.04B yields $1.66B of probability-weighted DM1 value—only about $150M, or 10%, above the price-implied allocation. A marginal vHOT result could erode that cushion through FDA’s endpoint judgment, HARMONIA, EU timing or a slower commercial ramp. We have not estimated the frequency or value of strong versus marginal wins.
The hurdle is sensitive to the assumptions that matter most. At 45% REC odds it falls to about 83%. At 50% treated share it falls to about 61%; at 20%, REC odds would need to reach roughly 75% even if every win retained the full unrisked value. Each $100M of DM1 value preserved after a miss lowers the base hurdle by about 3.6 percentage points (Appendix, notes 10 and 13).
Our assumptions pull in both directions. Uptake of 35% of treatment-eligible patients is generous against the closest analog, while zero value after a REC miss is severe. The price looks attractive under this framework only if REC odds, value after a win or peak uptake exceed our base assumptions.
6. DMD resets the bridge before the REC
We make no directional call on the REC readout. Our roughly 41% probability covers statistical success, while the stock reaction depends on the size and credibility of the effect. Dyne’s DMD decision comes first—and our work on that asset is less developed than our DM1 analysis.
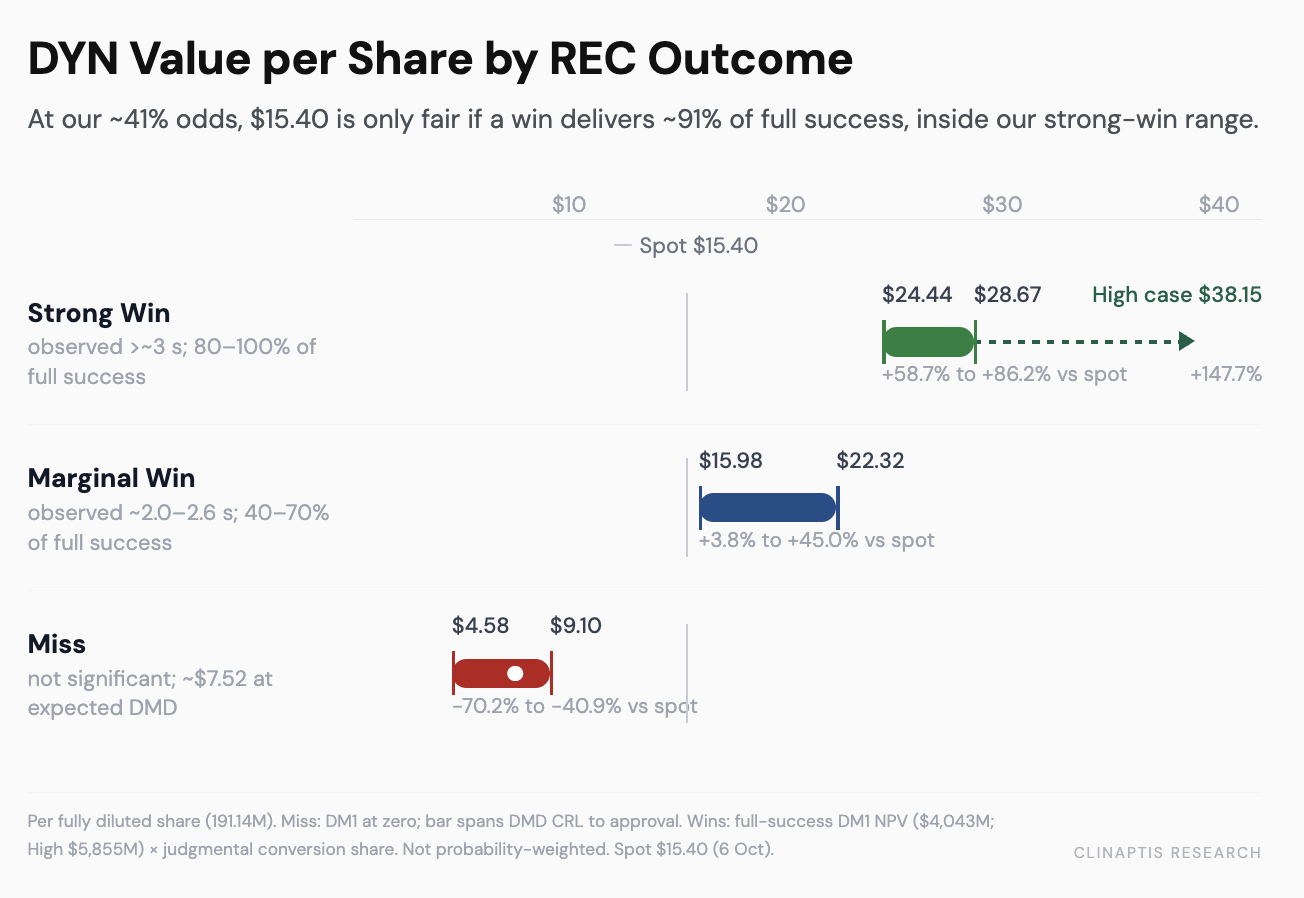
We assign DMD $611M of expected value, using a judgmental 65% approval probability and a 20% discount to cash flows after 2030 for confirmatory risk. FDA’s 21 January 2027 decision could move that allocation to $914M on approval or $50M after a complete response letter. We would then rebuild the DM1 price bridge using the prevailing share price, capitalization and financing outlook.
 Open full resolution ↗
A strong REC result—an effect near or above three seconds, a tight interval and supportive functional measures—would favor a higher fraction of our unrisked DM1 NPV. A marginal win would leave FDA’s judgment of vHOT and HARMONIA carrying more of the valuation. A miss would leave a possible HARMONIA route while shifting the near-term equity case toward DMD, cash and the platform. The share-price ranges in the figure are illustrative outcomes, not probability-weighted targets.
 Open full resolution ↗
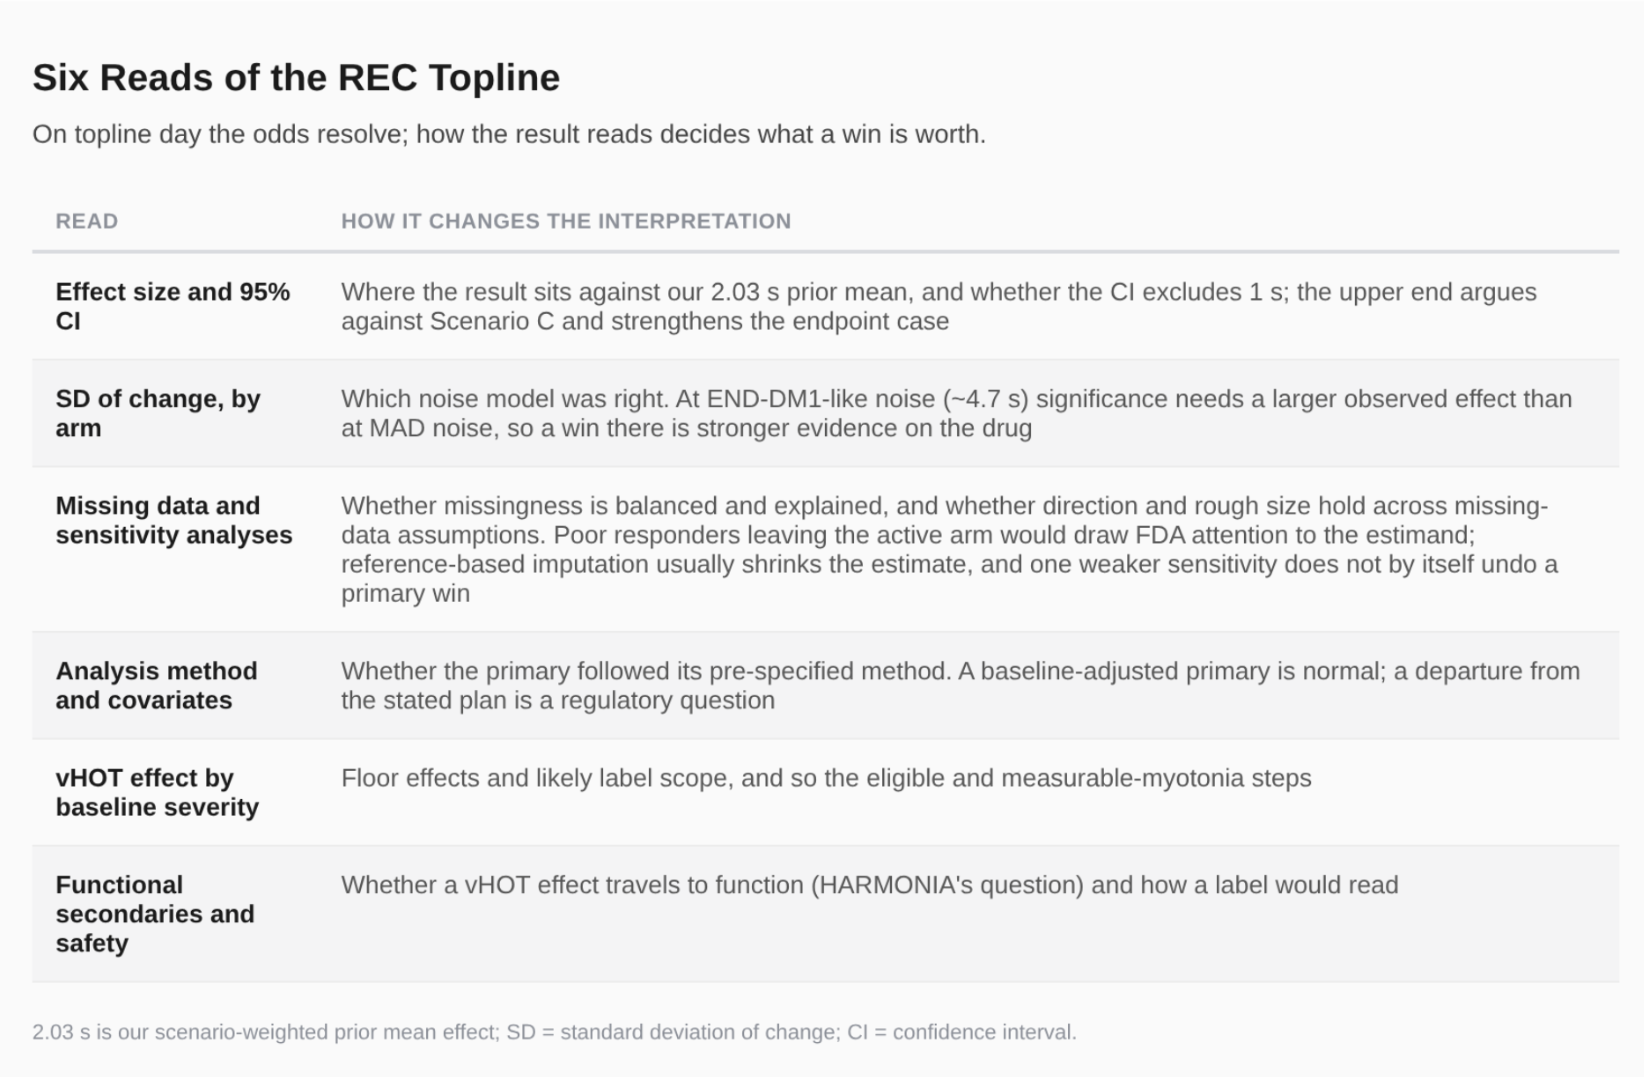
Full HARBOR data could change our weight on Scenario C before the REC. At topline, we will read the effect and its 95% interval against one second, change SD by arm, functional secondaries and missing-data sensitivities (full checklist in the Appendix). A large, stable effect with function moving alongside it would change the valuation case; a bare p-value would leave much of it open.
Appendix
Methods and valuation inputs
1. REC power (§2). We model 53 active and 18 placebo patients using an unadjusted, two-sided Welch test at α=0.05. At ACHIEVE MAD change SDs of 4.4 seconds active and 3.4 placebo, power is 89% for a 3.3-second effect, 80% at about 2.9 seconds and near 50% at 2.0 seconds. At END-DM1’s 4.7-second change SD, power at 3.3 seconds is about 70%. Management’s roughly 90% power is consistent with the unshrunk ACHIEVE effect; its assumptions are undisclosed.
2. Change-noise check (§2). REC baseline vHOT SD is 6.0 seconds, versus roughly 3.0–3.8 seconds in MAD. If the REC’s six-month SD remains 6.0 seconds and baseline-to-six-month correlation is no higher than vHOT’s roughly 0.7 test–retest reliability, change SD is at least 4.6 seconds. Achieving MAD-like change SDs of 4.4 or 3.4 seconds under that same-spread assumption would require correlations of about 0.73 or 0.84. Neither follow-up spread nor correlation is known before topline.
3. HARBOR likelihood (§1). HARBOR randomized 159 patients 1:1; its primary assessment moved from Week 30 to Week 54 after enrollment closed. Assuming a 4.7-second change SD and an unadjusted two-sided test, a miss was about 48% likely with a true 1.5-second effect and 2% likely at 3.0 seconds—a roughly 25-fold likelihood ratio. At 6.0-second SD, that ratio falls to about sixfold. Novartis has not disclosed the effect or variance needed to identify the cause of the miss.
4. Scenario C (§1). Pooling the small ACHIEVE dose result with MARINA’s exploratory randomized vHOT signal (−2.90 seconds; 12 active, eight placebo) gives a prior effect of 3.07 seconds (SE 1.31). Updating on the HARBOR miss yields about 1.27 seconds at 4.7-second change SD, with an 80% interval of 0.2–2.3 seconds. The estimate ranges from 0.8 to 1.7 seconds across change SDs of 3.5–6.0 seconds. MARINA and HARBOR tested the same compound, so the prior and update are not independent; transfer to Dyne is an assumption.
5. PoS conventions (§1, §2). Our 38–51% range averages trial power over the A/B/C effect distributions at zero dropout, using END-DM1 and MAD noise as the endpoints. The roughly 41% working estimate gives greater weight to END-DM1-like noise and incorporates 5% dropout. A simple two-thirds weight on the displayed 38% and one-third on 51% gives 42.3% before dropout. Moving C’s mean from 1.25 seconds to 0.8 or 1.55 seconds changes the range to 35–47% or 40–54%; changing C’s weight by ten points moves PoS by roughly three points. These are assumption sensitivities, not confidence intervals.
6. Patient-level simulation (§2). We simulate 53 active and 18 placebo patients using the A/B/C priors, REC baseline SD of 6.0 seconds and 100,000 trials per cell. At zero dropout, the model reproduces analytic PoS of 50.7% at MAD noise and 38.0% at END-DM1 noise. Robust baseline adjustment adds roughly 2–5 points under the base assumptions. Random dropout costs about 1.5 points per 5% of patients; imputing active dropouts as placebo at 10–20% dropout costs 6–17 points versus robust adjustment. Selective loss of poor active responders can instead inflate nominal significance. A responder-mixture and baseline-scaled-noise extension gives roughly 38–48% PoS at 5% dropout when constrained by ACHIEVE’s pooled 3.5-second active change SD, averaging about 45%. That SD pools doses and former placebo patients, so we retain 41% as the headline. The REC analysis plan and missingness remain undisclosed.
 Open full resolution ↗
7. MOXIe (§3). Omaveloxolone’s Friedreich ataxia approval rested on MOXIe (103 randomized; 82 in the primary population), with an mFARS difference of −2.41 versus placebo (p=0.0138). We use it only as a procedural example of a prespecified analysis and sensitivity work, not as evidence that FDA will accept vHOT. We have not reviewed FDA’s statistical assessment.
8. US patient funnel (§4). Dyne does not define its estimate of roughly 40,000 US patients. We treat it as diagnosis-based, apply a 10% prevalence haircut, then model successive myotonia, eligibility and uptake shares: 40,000 → 36,000 → 32,400 → 29,160 → 22,453 → 16,840 REC-like → 10,946 treatment-eligible → 3,831 treated at peak. The clinical filters and uptake shares are our assumptions. The exhibit’s narrowed low/base/high cases produce 2,593/3,831/5,305 treated patients.
 Open full resolution ↗
 Open full resolution ↗
9. Unrisked DM1 NPVs (§4). US/EU/global values are $1,868M/$641M/$2,510M in the low case; $3,070M/$972M/$4,043M in the base; and $4,488M/$1,367M/$5,855M in the high case. Delaying EU launch to 2030 reduces the base to $3,902M; removing EU reduces it to $3,070M. An illustrative HARMONIA failure with no EU revenue and 30–50% lower US revenue from 2030 gives $1.3–2.0B. That is an assumed economic response, not a forecast.
10. Valuation hurdle (§5). Required value after a win as a share of unrisked NPV is [I − (1 − p)M] ÷ (pV), where I is the $1,506M price-implied DM1 value, p is REC statistical-win probability, M is DM1 value after a miss and V is unrisked DM1 NPV. With p=41%, M=0 and V=$4,043M, the hurdle is about 91%; it is 98–73% across p=38–51%. Each $100M retained after a miss lowers the base hurdle by about 3.6 percentage points. At the low and high case NPVs, the 41% hurdle is about 146% and 63%.
 Open full resolution ↗
11. EV bridge (§5). At $15.40 and 191.14M fully diluted shares, market cap is $2,944M. Less approximately $1,145M liquidity and plus $211M adjusted debt gives $2,009M EV. Subtract $611M DMD and a $250M FSHD/platform allocation; add back $261M present value of corporate overhead and $97M pre-readout DM1 spending. The comparable price-implied DM1 value is $1,506M. Liquidity is carried from the 2 October bridge rather than freshly measured at the 6 October close.
12. REC miss-state equity (§6). With DM1 assigned zero, expected DMD value of $611M plus the $250M platform allocation and approximately $1,145M liquidity, less $211M debt, $261M overhead and $97M pre-readout spend, gives $1,437M equity value, or about $7.50 per fully diluted share. Substituting $914M DMD approval value yields about $9.10; substituting $50M after a complete response letter yields about $4.60. These values must be refreshed after the DMD decision.
13. Uptake sensitivity (§4, §5). Holding other inputs fixed, moving treated share from 20% to 50% changes unrisked DM1 NPV from roughly $2.0B to $6.1B, versus $4.04B at the 35% base. This is wider than the exhibit’s narrowed low/high cases, which move eligibility and uptake together.
 Open full resolution ↗
 Open full resolution ↗
DMD valuation
We value DMD to isolate the amount of Dyne’s enterprise value attributable to DM1. Z-rostudirsen seeks accelerated approval for exon-51-amenable DMD, with an FDA decision due 21 January 2027. We assume roughly 1,600 eligible US patients, 33% peak share and an $800,000 net annual price. Our approval case is worth $914M; a complete response letter leaves a $50M refiling option. At 65% approval odds, the risk-adjusted value is about $611M.
The approval case retains 80% of modeled cash flows after 2030 to allow for FORZETTO’s confirmatory and continued-approval risk. Its primary measures rise-from-floor velocity. Two relevant exon-skipping confirmatory trials missed their primaries: RACER53 on time-to-stand velocity and ESSENCE on four-stair ascend velocity. ESSENCE’s prespecified comparison was 0.05 steps per second (p=0.309). Neither miss has yet led to US withdrawal of the marketed drug, but the regulatory outcomes remain unsettled; FDA action on Sarepta’s traditional-approval filings is due 28 February 2027. These precedents inform our judgment, not a measured failure or withdrawal rate. The 20% reduction is an assumption, not an empirically derived expected loss.
Sources
-
Dyne press releases: 17 Jun 2025 8-K (BTD, Type C); 3 Jun 2026 (REC enrollment); 20 Jul 2026 (DMD BLA acceptance); 29 Sep 2026 (ACHIEVE one-year data, REC baseline)
-
Dyne results: Q4/FY2025 results; Q1 2026 results; Q2 2026 results and 10-Q
-
Dyne World Muscle Society (WMS) 2026 ACHIEVE slides and AANEM 2026 poster
-
Novartis HARBOR PR and 6-K (8 Sep 2026)
-
ClinicalTrials.gov NCT05481879 (ACHIEVE) and NCT06411288 (HARBOR); EU CTIS 2024-511378-60-00 (HARBOR protocol v8.2, redacted)
-
PepGen FREEDOM2 timing and mechanism: PR of 6 Aug 2026 and Q1 2026 results
-
Avidity FY2025 10-K; MARINA, NEJM 2026;394(8)
-
END-DM1 vHOT paper, Neurology 2026;106(7):e214747
-
ICER, Launch Price and Access (Oct 2025)
-
Johnson et al., Neurology 2021 (genetic prevalence)
-
Exon-skipping precedent: Global Genes on RACER53 (May 2024); Clinical Trials Arena on ESSENCE (4 Nov 2025); BioPharma Dive on ESSENCE and FDA withdrawal threshold; BioPharm International on sNDA acceptance (30 Jun 2026)
-
MOXIe: ClinicalTrials.gov NCT02255435 (Part 2 SAP); FDA Drug Trials Snapshot, Skyclarys
-
HARMONIA: ClinicalTrials.gov NCT07486934 (estimated primary completion Jul 2028)
-
Treated-share analogs: MDA 2026 abstract, SMA US claims (Komodo); Fierce Pharma on Skyclarys patients; Managed Healthcare Executive on FA prevalence
-
DYN and XBI closes: S&P Global Market Intelligence via StockAnalysis
-
Valuation, REC prior and patient-level simulation: Clinaptis analysis