
The $1–5B bear book kept adding through an August rally and a September decline: builds outran covers 24 to 17, then 27 to 7.
August’s crowded short book survived a +10.5% index month (Jul 31 to Aug 31) without covering. September removed the rally as an excuse. XBI peaked at $169.6 on Aug 19, gave up $160 on Sep 9, and closed the window at $154. The book still did not cover.
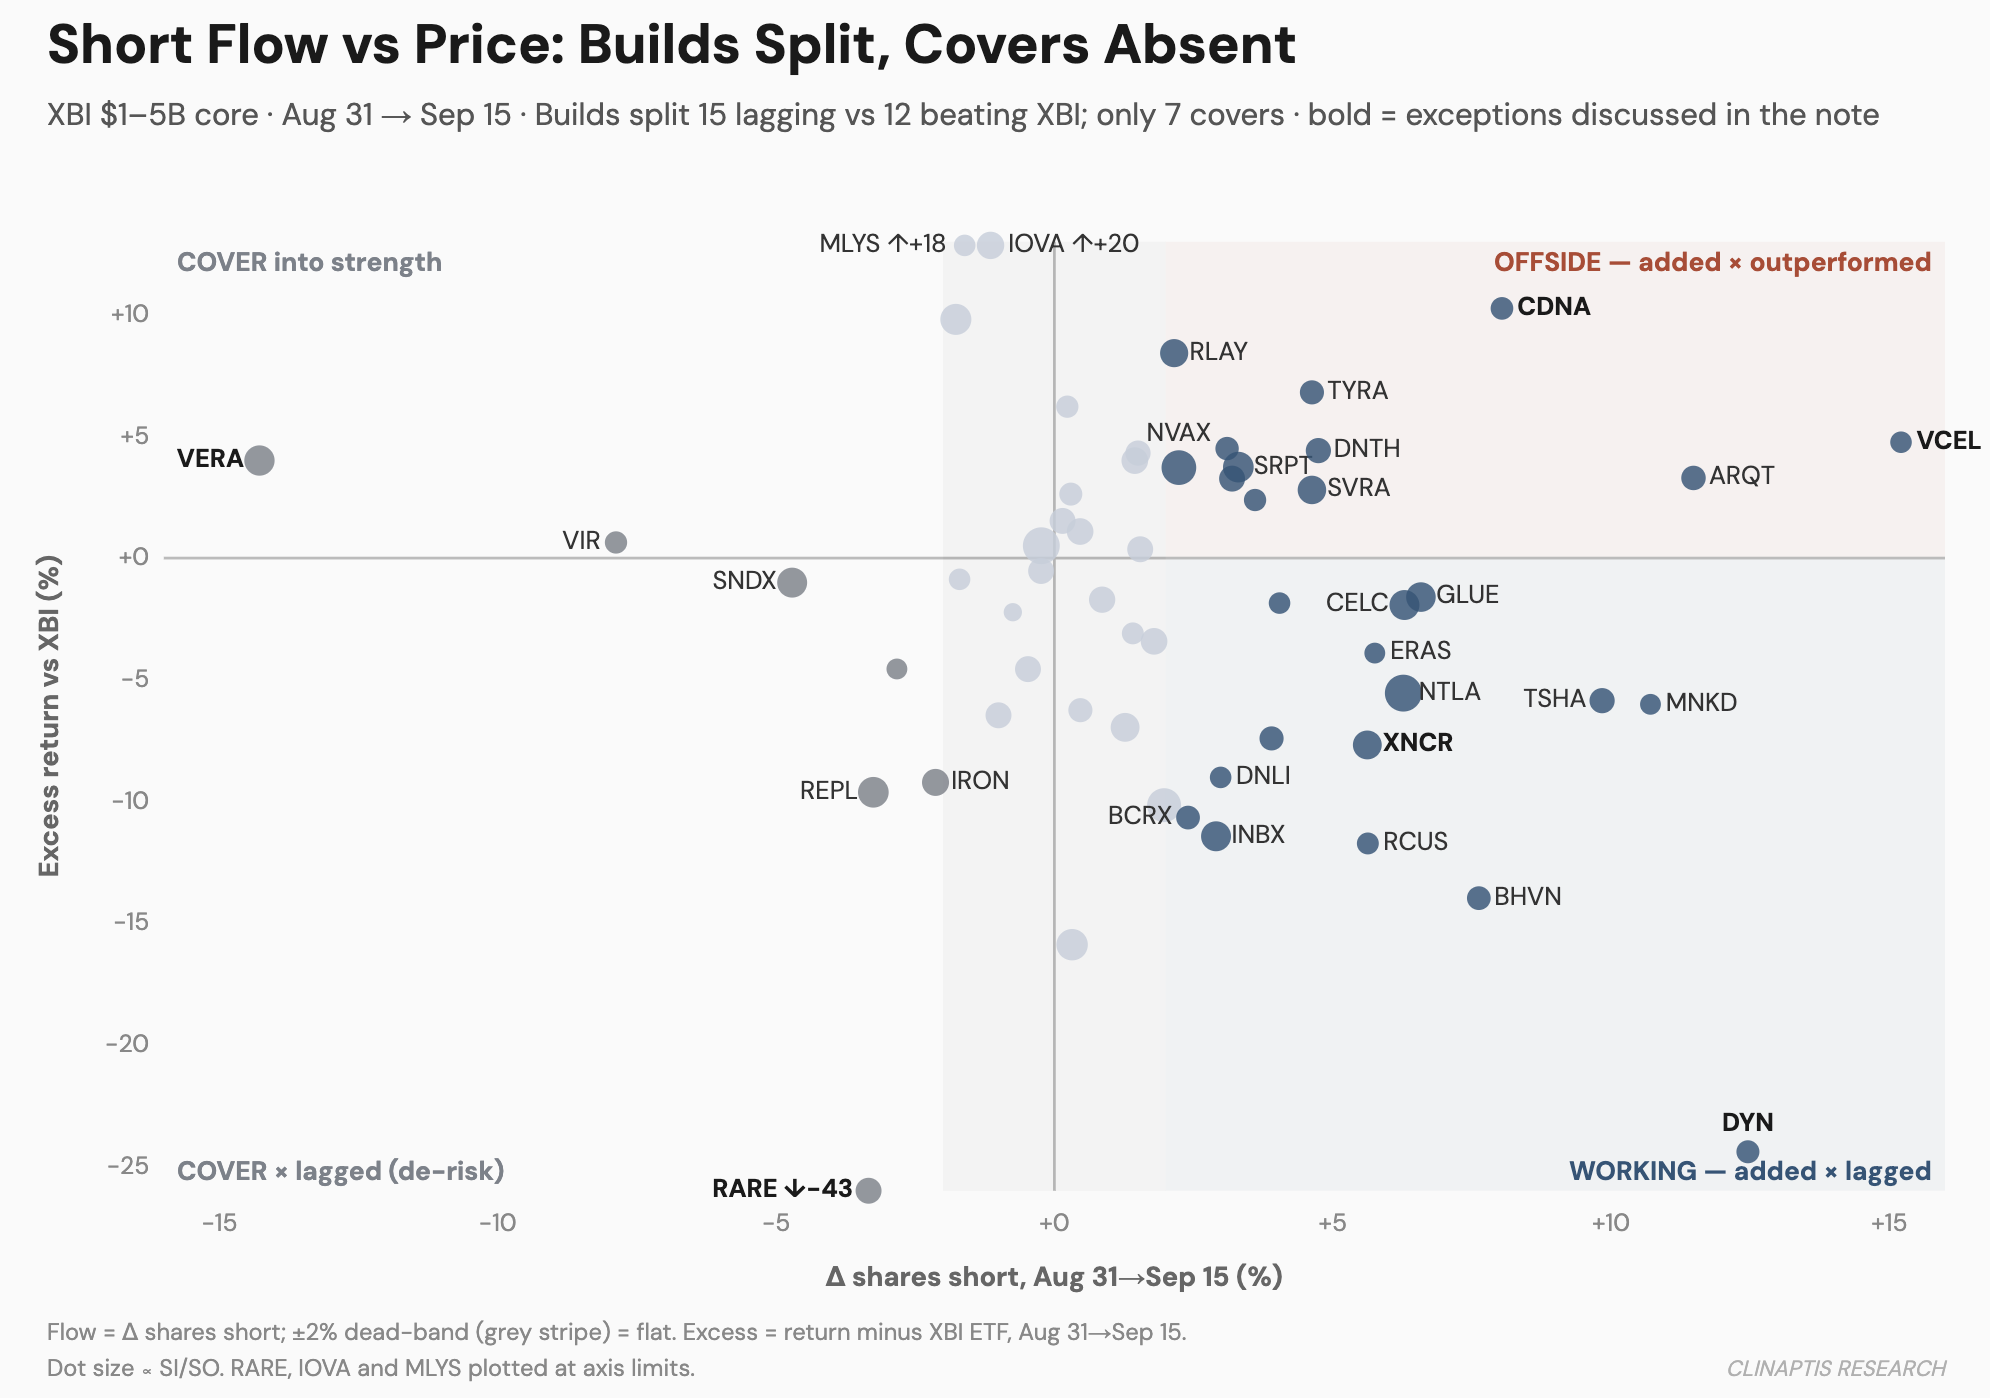
Across the 57 names in the $1–5B core, 27 added shares short between Aug 31 and Sep 15, 7 reduced, and 23 barely moved (under 2%). The half-month before, with XBI rising, is the harder test: 17 names covered, yet 24 built and the core’s short position fell only 0.4%. Covering more than halved once the tape turned down.
What the flow does not show is that the builders were right. Of the 27 builders, 15 lagged XBI (56%), the same rate at which the whole core lagged the ETF (32 of 57). The seven coverers lagged more often (5 of 7). The separation sits in magnitude, not hit rate: builders that lagged trailed by a median 7.4 points, and builders that beat XBI did so by 4.1. We read the book as persistent, not prescient.
The value of the data therefore moves away from following the shorts and toward the exceptions: builds that are offside, builds anchored to a dated catalyst, positions that are mechanical rather than directional, and the rare cover that is a change of mind. The absolute short-interest level matters less than the change in positioning, and whether that change is working against the tape.
Two convention notes. Sep 15 is a FINRA mid-month settlement, used here as an endpoint in its own right. And this note publishes two weeks after that settlement date: where material events landed after Sep 15 (FDA’s Sep 17 approval of Ultragenyx’s UX111, Arcus’s Sep 22 announcement of an Oct 20 casdatifan investor event), we flag them, but the flow cannot speak to them.
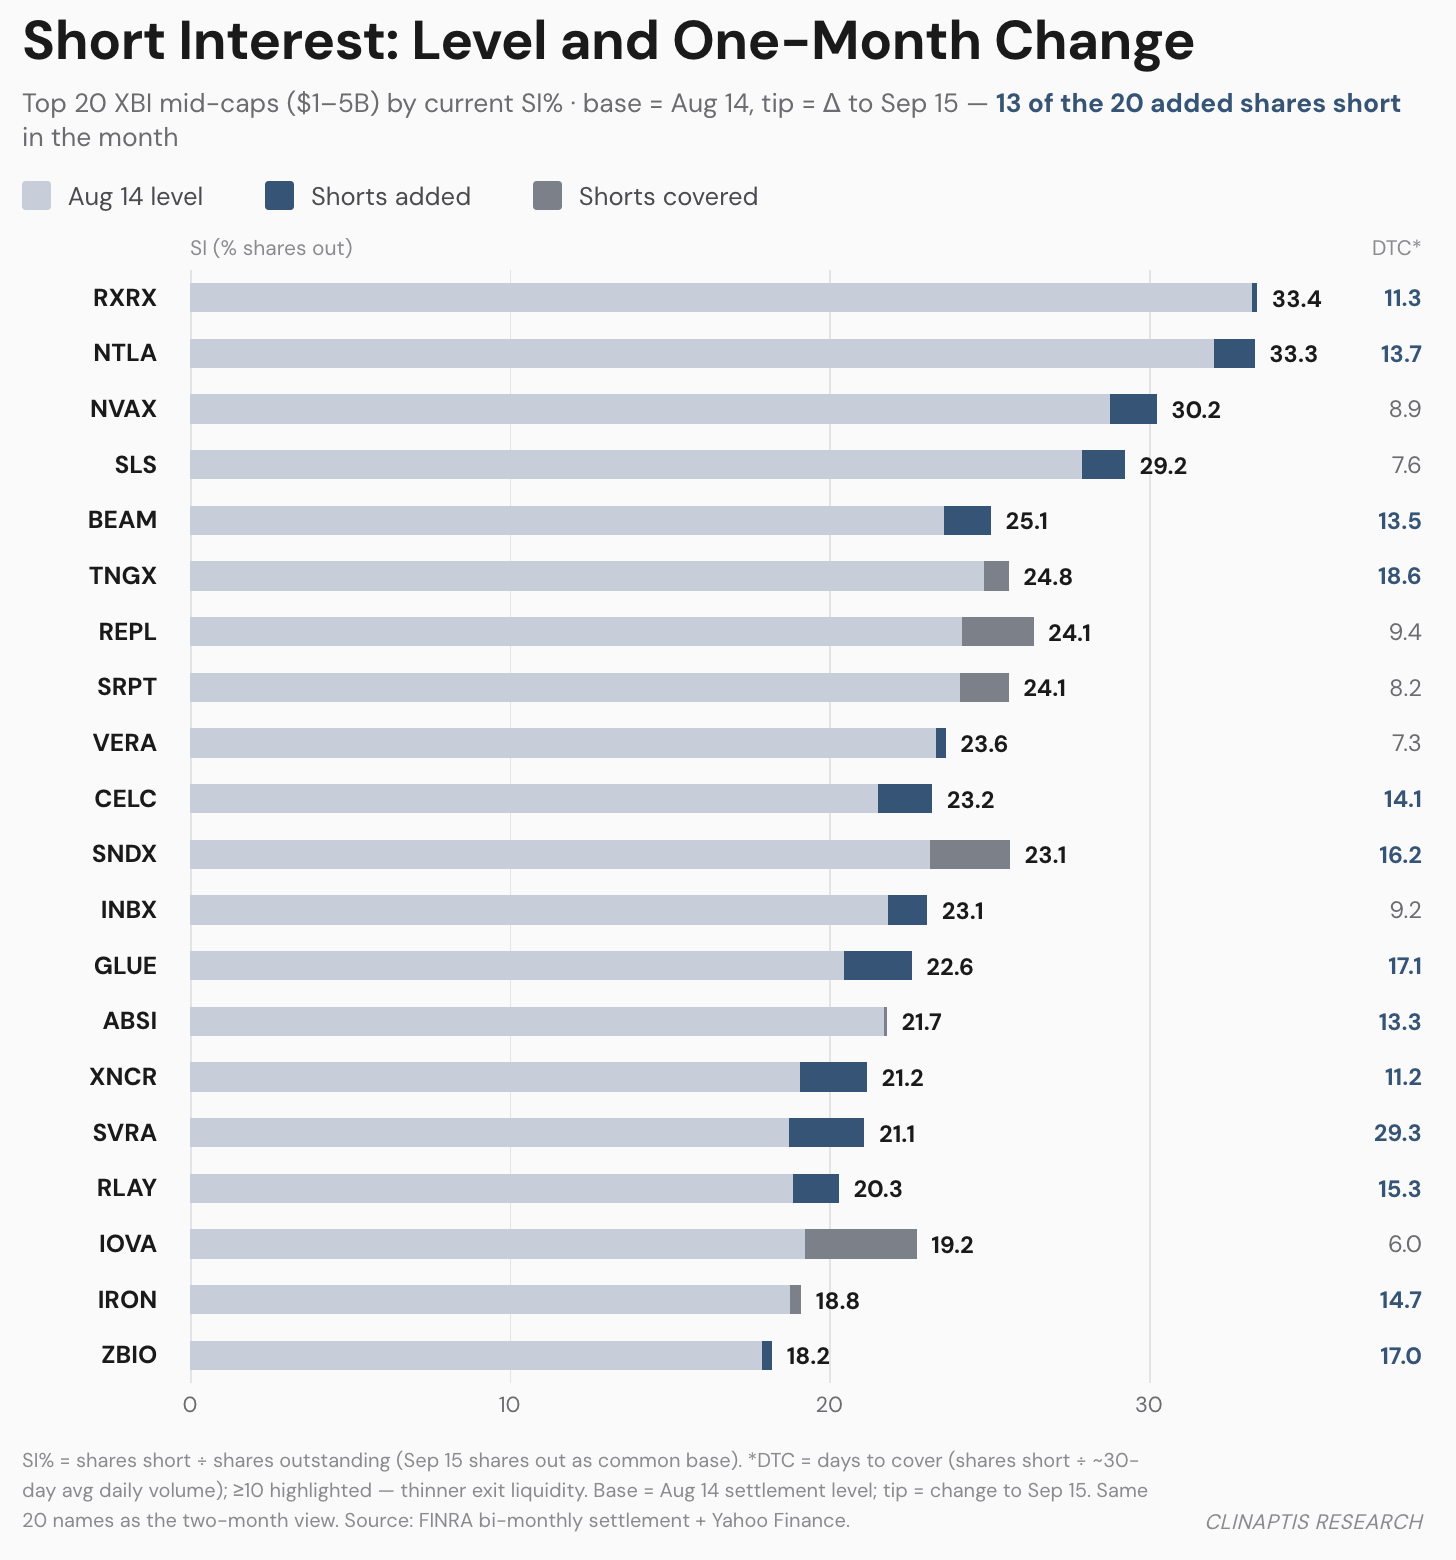
F1 below shows the net change over Aug 14 to Sep 15; the counts in the text are Aug 31 to Sep 15, so a name can differ. VERA built through August and covered in September; SRPT did the reverse.
 Open full resolution ↗
Where the conviction actually went
Adding into weakness is the largest quadrant, though not by much: 15 working builds against 12 offside. The working group’s edge is size of move (median −7.4 points of excess), not frequency.
Some of that adding is anchored to a dated event. Biohaven (BHVN) has the clearest catalyst overlap: shorts built 7.6% into a stock that lagged XBI by 14.0 points, after the FDA placed a partial hold on new enrollment in the opakalim (BHV-7000) trials. The hold was issued Sep 4 and disclosed Sep 10, when the stock fell 17%, so part of the build preceded disclosure. Erasca (ERAS) built 5.8% ahead of its pan-RAS data at the EORTC-NCI-AACR symposium (ERAS-0015 oral, Nov 20). In both cases the flow sits next to a catalyst with a date on it, which is the most settlement data allows. Arcus (RCUS) screens like it but does not belong: shares short rose 5.6% while the stock trailed XBI by 11.7 points, but most of the decline came on Sep 10–11 on light volume with no disclosed company news, and the casdatifan investor event (Oct 20) was announced on Sep 22, after the settlement. We cannot attach a driver to the build.
Dyne (DYN) screens as the deepest working short in the cohort but is mechanical (see “Discount before counting” below); excluding it leaves 14 working builds out of 26. The remaining builds (TSHA, NTLA, GLUE, MNKD, CELC) are thematic; only Intellia has an in-window event that changes financing risk or regulatory probability. Detail is in Appendix B.
 Open full resolution ↗
When the same short changes meaning
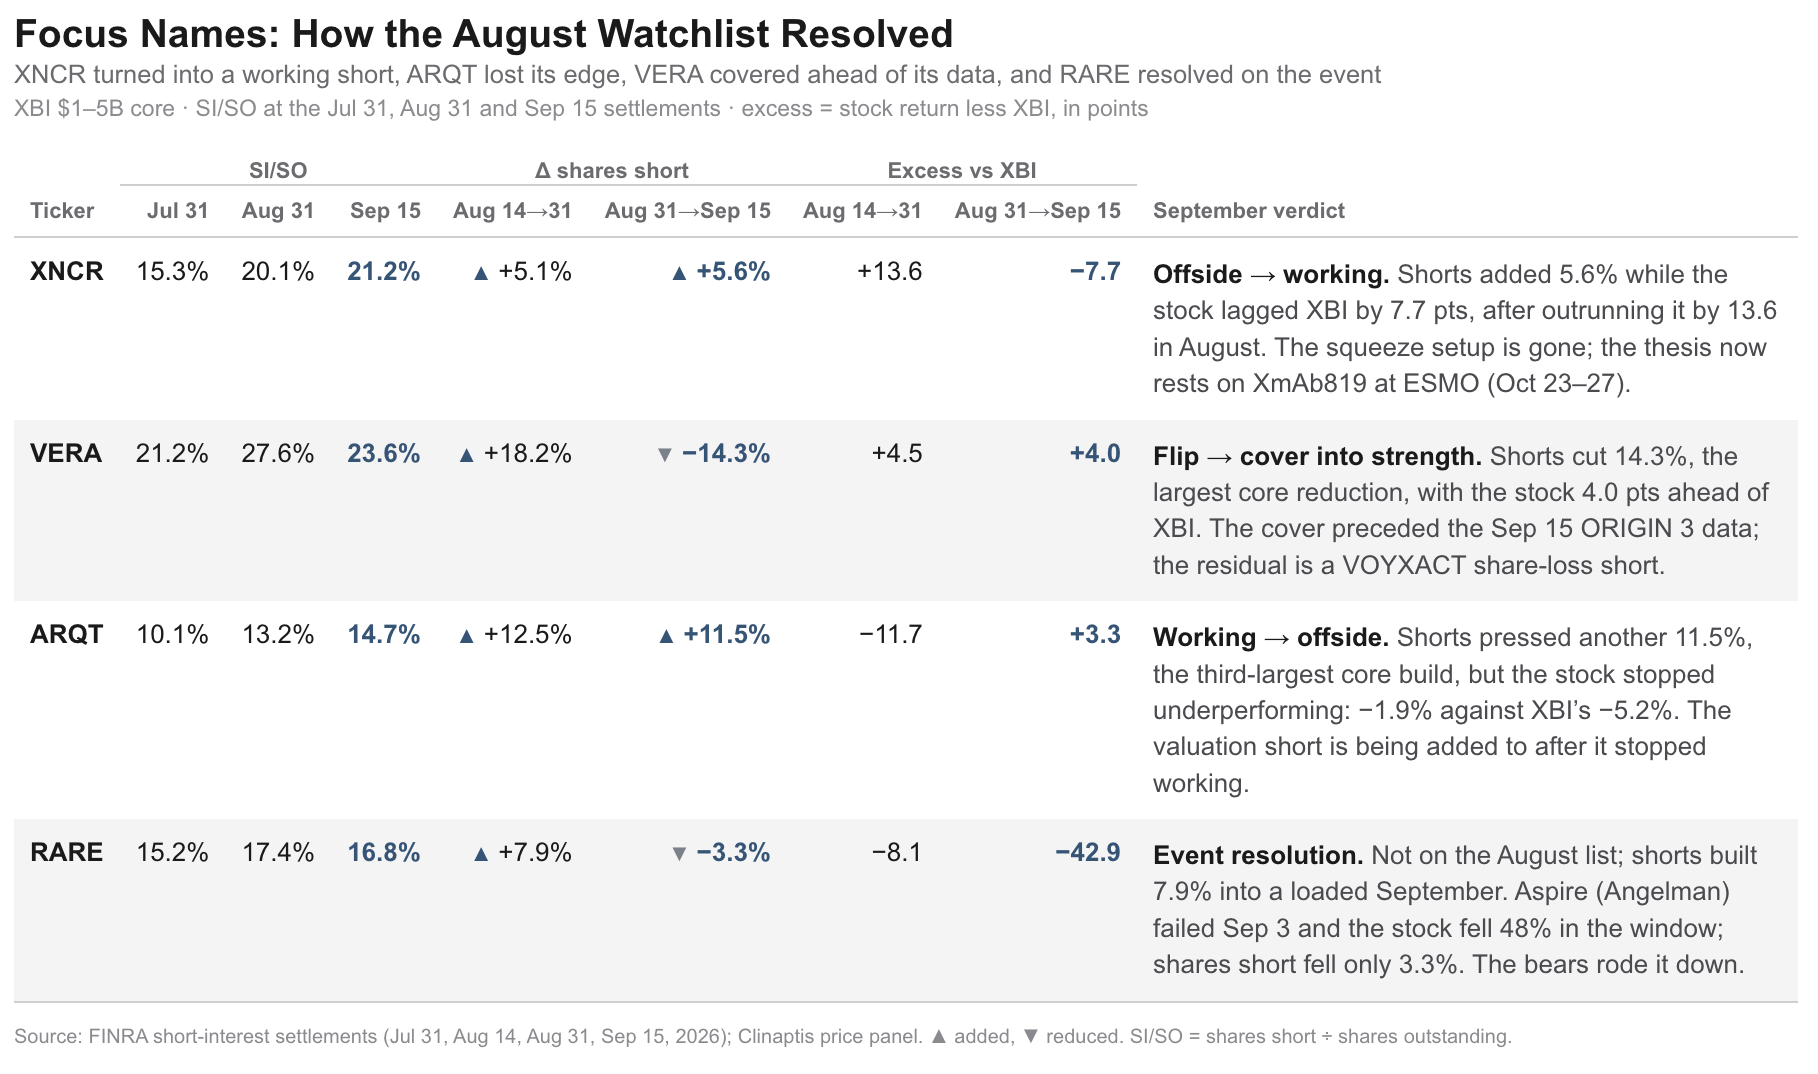
Xencor (XNCR) was August’s clearest offside short. Shorts added aggressively while the stock outran XBI in both halves of the month, with $105m of non-dilutive Alexion settlement cash arriving on top. The open question into September was whether the next settlement would separate high-conviction skepticism from a position about to be run over. It did: shorts added another 5.6% through Sep 15 while the stock lagged XBI by 7.7 points, and crowding rose from 14.6% to 21.2% SI/SO over the two months, the largest level increase in the top twenty. The build is no longer fighting the tape.
That does not make the short correct. It removes the squeeze setup and leaves the thesis to the XmAb819 ccRCC Phase 1 expansion data (accepted as an oral at ESMO, Oct 23–27, Madrid) rather than to positioning. A short that was offside in August and working in September has resolved nothing fundamental; it has simply stopped costing money.
Arcutis (ARQT) ran the same flip in reverse. In August it was a working valuation short: the stock fell in both halves while ZORYVE revenue compounded (August-period: $129.9m, +23% sequential, FY guidance raised to $525–540m). Nothing broke operationally; the multiple did the work. Through Sep 15 shorts pressed harder (+11.5%, the third-largest build in the core) and the stock stopped underperforming: it slipped 1.9% against XBI’s 5.2% decline (+3.3 points of excess). The valuation short is still being added to after it stopped working. In both names the position did not change; its P&L context did.
 Open full resolution ↗
The offside builds are the better watchlist
Twelve names added shares short while beating XBI, with a median build of +4.1% and a median excess return of +4.1 points. Vericel (VCEL) posted the single largest build in the entire core (+15.2%) against a stock that held up (+4.8 points). CareDx (CDNA) built 8.0% while beating XBI by 10.3. Relay (RLAY, +2.2% / +8 points) and Tyra (TYRA, +4.6% / +7 points) sit in the same quadrant.
These are diligence and squeeze candidates, not long signals. VCEL and CDNA are commercial businesses with no company catalyst in the window (their last substantive events were the Jul 30 Q2 prints, both with guidance raised). We have not identified what the shorts are underwriting, and the size of the VCEL build relative to the cohort is the reason to look rather than a conclusion about the outcome.
Discount before counting
Four positions screen as signals and should be marked down before they enter any count.
Dyne (DYN) is the deepest working short in the cohort (+12.5% build, −24 points of excess). Novartis’s del-desiran missed its vHOT primary in the HARBOR Phase 3 in DM1 (Sep 8), and Dyne fell about 21% over Sep 8–9; its own one-year ACHIEVE data is still ahead. The position grew against a sector move, not a company-specific disappointment. Sarepta (SRPT) took the same hit (about −7% on Sep 8) but screens offside (+3.3% / +4 points) because an early-September rally nets against it. Novavax (NVAX) screens offside on a small build (+2.2%), but its $225m 4.625% convertible due 2031 covers 20.2M underlying shares at the $11.14 conversion price — up to 40% of the 49.9M-share short at full delta, and less with the stock at $9.23 — so a meaningful share of the short is plausibly arbitrage rather than a directional view. Above $8B, United Therapeutics (UTHR) posted the largest percentage build in XBI (+36.0%), closely matching the initial borrow on a $477.6m accelerated share repurchase (Appendix A). Contagion, convert hedging and ASR mechanics all add short interest without adding a view.
What actually got covered
Covering was scarce, and most of it was not a change of mind.
Vera (VERA) is the exception: the largest cover in the core, and the one most consistent with risk taken off before a readout. Shorts cut 14.3% while the stock beat XBI by 4.0 points. The level is still above July (23.6% vs 20.9% SI/SO): VERA built through August and unwound in September, after the position had already migrated its basis from approval risk to clinical risk to commercial risk. ORIGIN 3’s 104-week data (eGFR slope −0.6 vs −5.6, progression HR 0.24) landed pre-market on Sep 15, after the trades in the Sep 15 settlement, so the cover preceded the data: shorts left into the readout, and the stock gave back its pre-market gain (−1.1% on Sep 15, −5.6% on Sep 16). What remains is a share-loss argument against VOYXACT’s launch, held by a thinner crowd. Vir (VIR) also covered into strength (−7.9%), though at +0.6 points of excess it is a marginal case.
The other five reductions came with the stock falling. Ultragenyx (RARE) is the one that matters. On Sep 3 the Phase 3 Aspire study of apazunersen in Angelman syndrome missed its primary and key secondary endpoints; the stock closed down about 44% on the day, and the company announced a strategic review and significant expense cuts. Across the window RARE lagged XBI by 43 points while shares short fell only 3.3%: the bears rode the resolution rather than exiting ahead of it. VERA and RARE both reduced short interest, and they mean nearly opposite things. VERA was risk taken off ahead of a catalyst; RARE was a short kept on through one. (FDA’s Sep 17 approval of UX111 in MPS IIIA came after the settlement and is secondary.) Replimune (REPL, −3.3%), Syndax (SNDX, −4.7%), Disc Medicine (IRON, −2.1%) and Janux (JANX, −2.8%) show the same shape at lower amplitude, with modest de-risking alongside underperformance.
Most of the crowded book did nothing
Twenty-three of 57 names moved less than 2% in either direction, with a median excess return of −0.5. The largest short positions in XBI are largely inert.
Recursion (RXRX) carries the highest crowding in the cohort (33.4% SI/SO) and has barely moved in two months (−0.4pp since Jul 15). Tango (TNGX, 24.8%) and Inhibrx (INBX, 23.1%) sit in the same condition. A screen ranked on SI/SO would lead with RXRX and miss every name discussed above.
Intellia (NTLA) shows why level alone is not enough. It sits at 33.3% SI/SO, statistically identical to RXRX, and added another 6.3% while lagging XBI by 5.5 points.
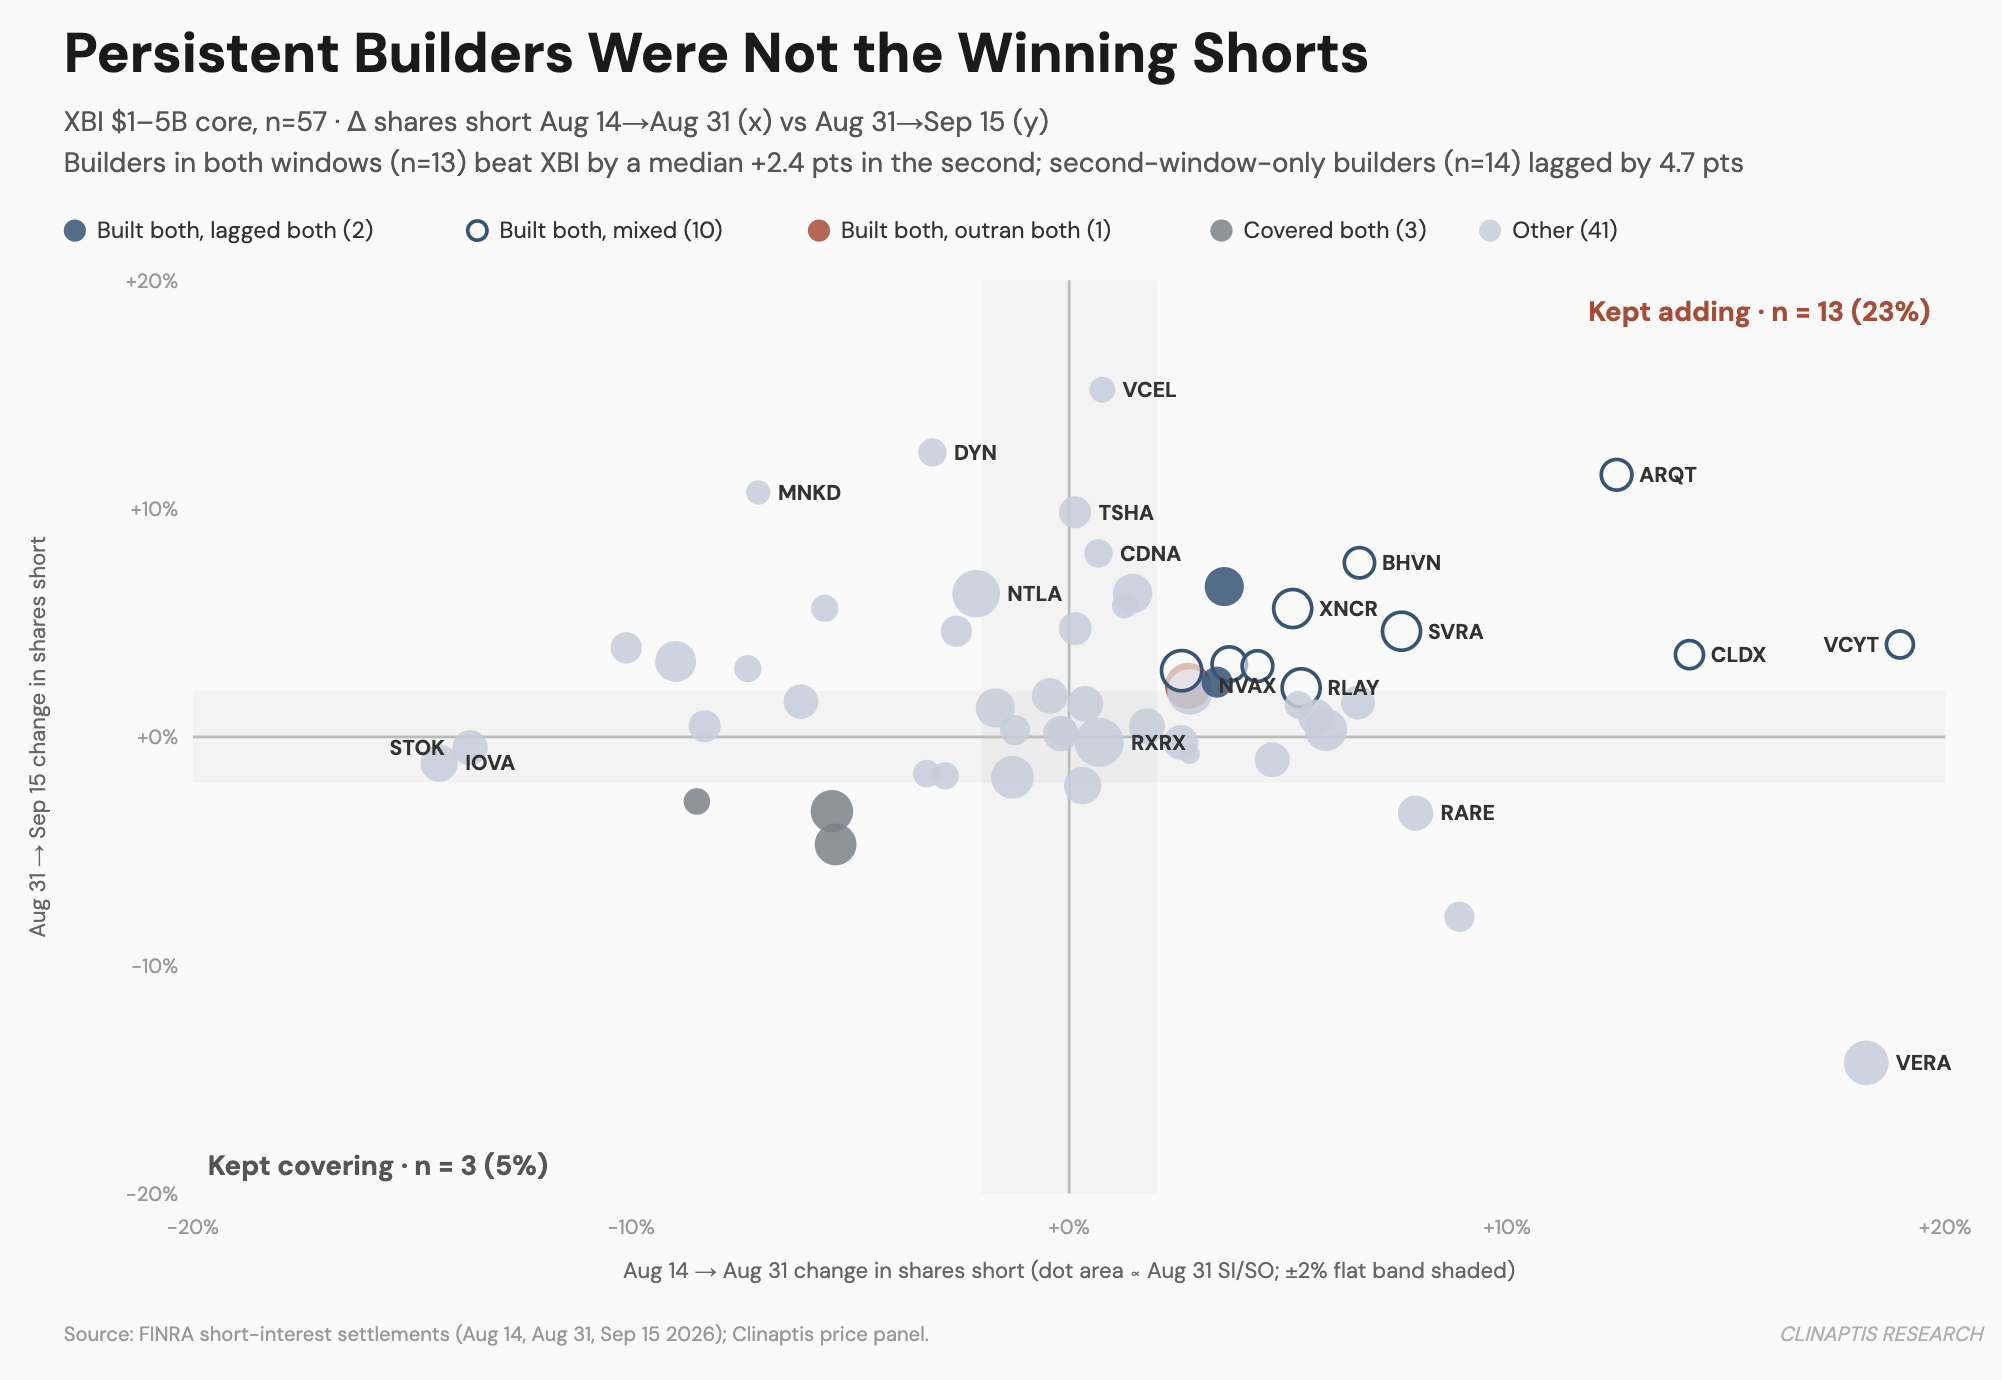
Persistence did not separate winners from losers. The 13 names that built in both half-months beat XBI by a median 2.4 points in the second and lagged 6 times out of 13 (46%); the 14 that built only in the second lagged 9 times out of 14 (64%), by a median 4.7 points. The persistent group leaned offside (ARQT, SVRA, RLAY, CLDX and VOR all beat XBI in the second window), though the counts are small and untested.
 Open full resolution ↗
Above $5B: the covering was at the top
The $5–8B tier echoes the core (median flow +1.5%; IMVT, TVTX and SRRK added into weakness). Above $8B, the 30 XBI constituents are read against their own tier median, not XBI, because the group fell only 1.4% while XBI fell about 5%. There is no crowded book there (median SI/SO 6.0%), and the flow is two-sided: nine names added 2% or more and six reduced, against 27 and 7 in the $1–5B core. Four of the six covers beat the tier median (GILD, MRNA, NTRA, EXEL), against two cover-into-strength names in the core (VERA and VIR). The one-sided book is a $1–5B phenomenon. Tier detail, including UTHR, is in Appendix A.
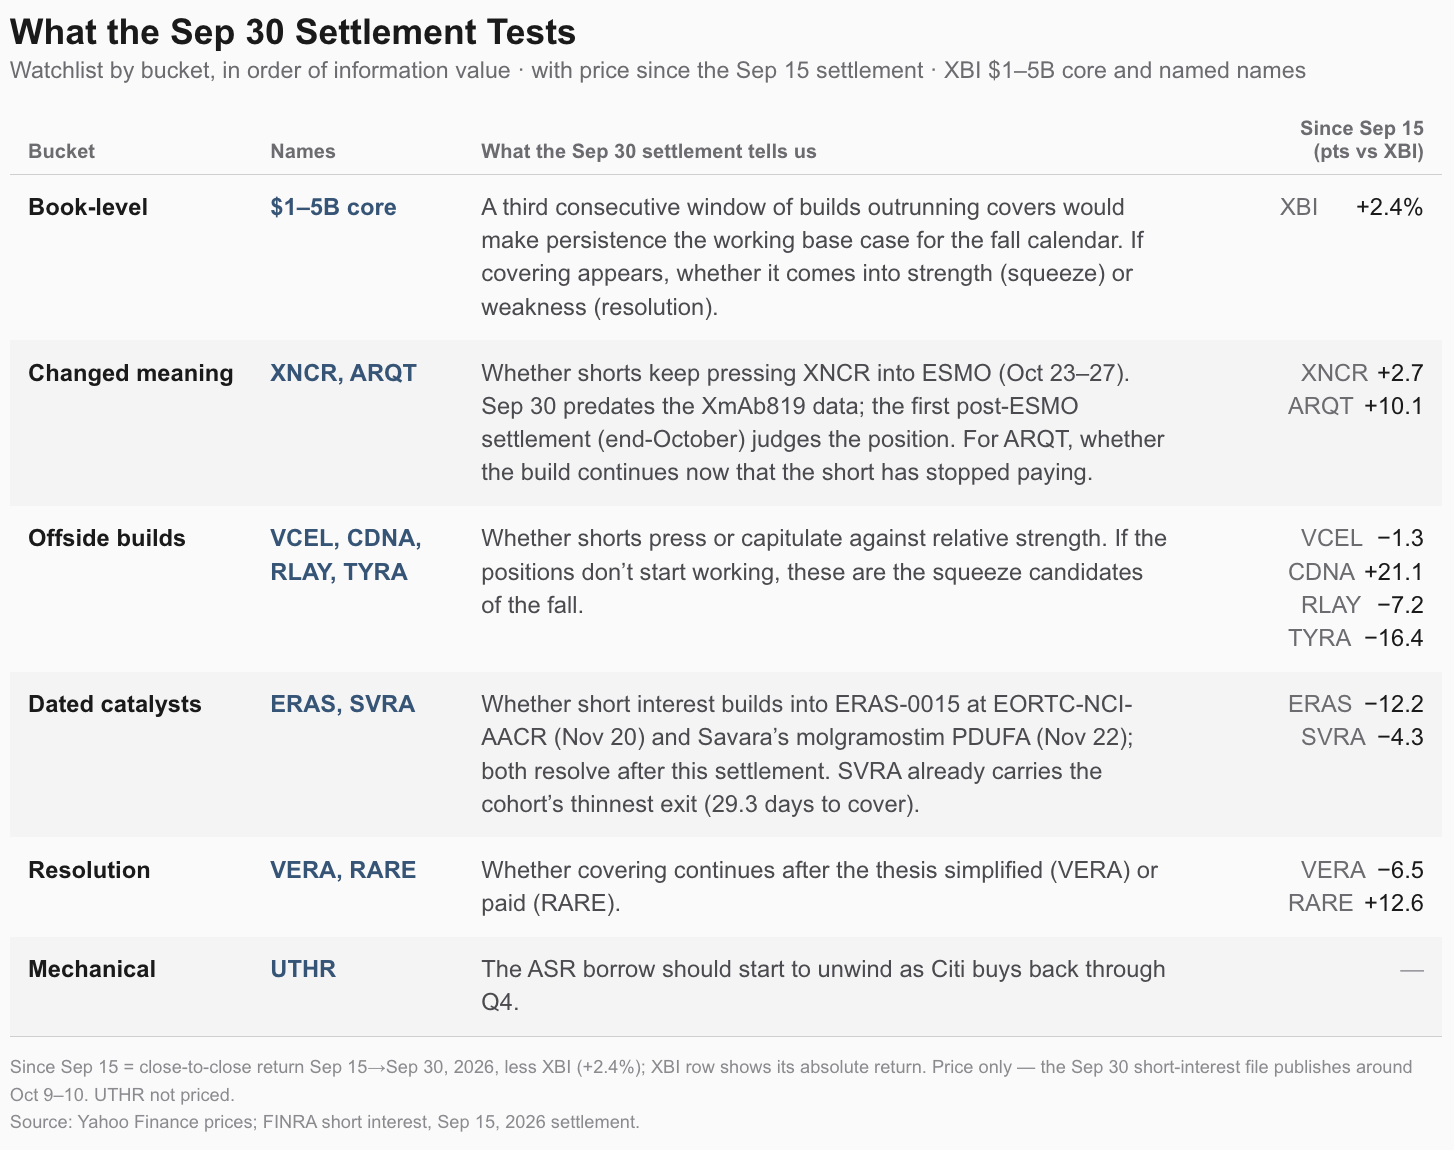
What the September 30 settlement tests
In order of information value:
 Open full resolution ↗
The last column is price only: each name’s return from the Sep 15 to the Sep 30 close, less XBI’s +2.4%. It says nothing about positioning until the Sep 30 short-interest file is published (around Oct 9–10).
Across two consecutive windows, through an index that rose 10.5% in August and fell about 5% in September, the $1–5B biotech short book still has not reduced. Its builders lagged XBI at the same rate as the cohort itself (56% against 56%), and its covers were no better timed in aggregate (5 of 7 lagged), VERA the exception. Short covering has not been a source of demand for small- and mid-cap biotech. That is the condition to test again at month-end.
Method and limits
Crowding is shares short divided by shares outstanding; flow is the change in shares short. We read four settlements — Jul 31, Aug 14, Aug 31 and Sep 15. Aug 31→Sep 15 is the principal flow lens; Aug 14→Aug 31 is the like-for-like half-month comparison; Jul 31 anchors the August month and the focus names. Flow uses a fixed ±2% band, set in advance; because a fixed band classifies more names as flat over a shorter window, the build/cover comparison is also shown half-month to half-month (Aug 14→Aug 31 against Aug 31→Sep 15; 11 and 10 sessions). The result does not depend on the band: the median change in shares short rose from +0.7% to +1.8% between the two half-months, and the core’s aggregate short position moved from −0.4% to +1.8%. Hit rates are compared against the share of the full core lagging XBI over the same window (56%, 32 of 57), not against 50%. The core is every XBI name with a Sep 15 market cap of $1–5B, excluding corporate-action and stale-settlement names (n=57); adding the three names at the $1B boundary (CRVS, KURA, CGEM) gives n=60 with 28 builds, 9 covers and 23 flat, and builders still lag at the base rate (57% vs 58%). Names above $8B are benchmarked against their tier median (+3.8 points versus XBI), not against XBI. Excess return is each name against XBI, measured on the same settlement dates, because the index return overstates the median stock. Days to cover is Yahoo’s roughly 30-day measure, not DTC-20, and is a secondary column.
Corporate-action and stale-settlement names are excluded, not estimated; any position exceeding shares outstanding is nulled and flagged. Settlement data cannot establish intra-window timing or motive, and positions on a settlement date reflect trades through the prior business day, so events on the settlement date itself are not in the flow. We treat a dated event as a likely driver only if it falls inside the measurement interval and plausibly changes valuation, financing risk, regulatory probability or positioning; conference appearances and inducement grants do not qualify. Where we name a mechanism — contagion, squeeze, convert arbitrage, competitive read — it is a hypothesis consistent with dated public events, not something the flow demonstrates. A stock falling after shorts added does not establish that the shorts were right.
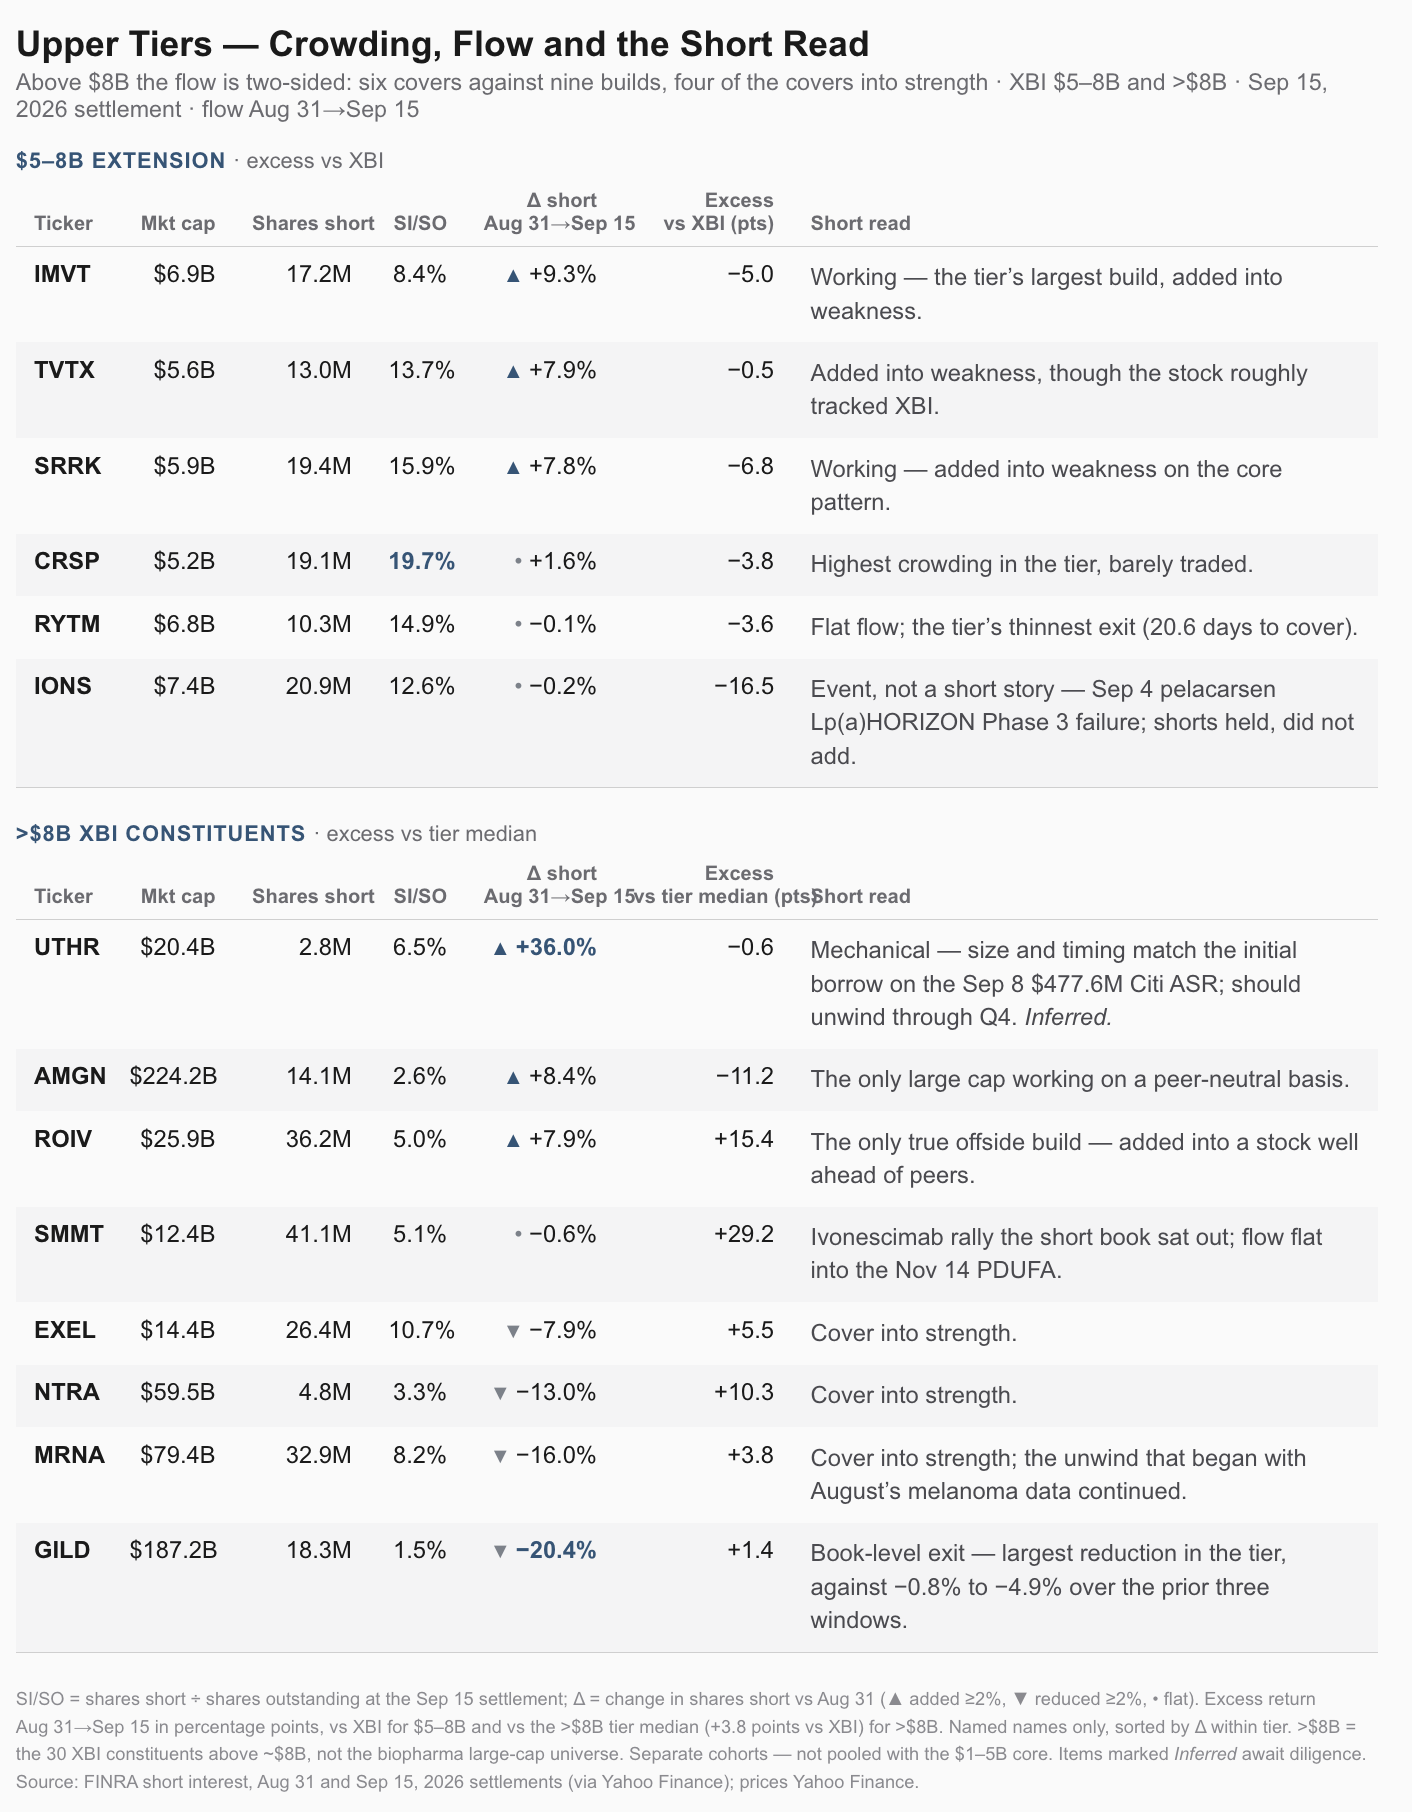
Appendix A — Upper tiers ($5–8B and >$8B)
 Open full resolution ↗
The $5–8B tier behaves like a muted version of the core: median 12.7% SI/SO, median flow +1.5%. IMVT, TVTX and SRRK add into weakness on the same pattern. Ionis (IONS) is the tier’s large move and not a short story: the stock fell on the Sep 4 pelacarsen Lp(a)HORIZON Phase 3 failure (Lp(a) lowered, primary cardiovascular composite missed) while short interest was flat.
Above $8B, the pattern is different. “Large cap” here means only the 30 XBI constituents above roughly $8B in market cap. It is not the biopharma large-cap universe: most major pharma sits outside XBI, and XBI’s equal weighting means these 30 are a sample of its largest members, not a cohort. We read them separately and never pool them with the core, for a mechanical reason. In a window when XBI fell about 5%, the median name in this group fell only 1.4%. Measured against XBI, 83% “beat the index”, so a raw offside/working split would describe size, not shorts. We benchmark these names against the group median (+3.8 points versus XBI) and read flow against each name’s own history.
Median SI/SO is 6.0% and median flow +0.2%: there is no crowded book here, only single-name activity, and the flow is two-sided. Gilead’s −20.4% compares with prior changes of −0.8% to −4.9% over the last three windows: a book-level exit, not a trim. AMGN is the only large cap working on a peer-neutral basis, ROIV the only true offside build, and SMMT ran 29 points past its peers with flat short interest — a move the short book sat out entirely.
United Therapeutics (UTHR) needs the most explanation. Its +36.0% build is the largest percentage build anywhere in XBI, against prior changes of −9.1% to +9.7%, and the stock finished in line with peers. The window contained FDA acceptance of the nebulized Tyvaso sNDA in IPF (Sep 2), a weak de-risking event, and a $477.6m accelerated share repurchase with Citi announced on Sep 8, covering the rest of the $2.0bn authorization. An ASR dealer typically borrows the initial shares (about 75% here, upfront payment on or around Sep 10) to deliver to the company, and that borrowed position appears as short interest. At the Sep 9 close (~$507) the initial delivery is roughly 0.71M shares; UTHR’s shares short rose 0.74M. The size and timing fit closely, so we read the build as mechanical rather than directional. That is an inference, not something settlement data shows; if it holds, the position should unwind as Citi buys back through Q4.
Appendix B — Secondary builder attribution
The rest of the group is thematic and should be held loosely, though three carry dated company events inside the window. Intellia (NTLA, +6.3%) announced a $400m OrbiMed debt facility ($75m upfront) on Sep 4 and Priority Review of the lonvo-z BLA on Sep 8 (PDUFA Mar 10, 2027), and the stock still lagged XBI by 5.5 points. Monte Rosa (GLUE, +6.6%, 22.6% SI/SO) announced the start of the MRT-6160 Phase 2 in Sjögren’s, with a milestone payment, on Sep 8. MannKind (MNKD, +10.7%) announced the Rose Pharma inhaled GLP-1 collaboration on Sep 9. Of the three, only Intellia’s events change financing risk or regulatory probability; the GLUE and MNKD announcements are small, and we do not attribute those builds to them. Taysha (TSHA, +9.8%) had no substantive September event; its next dated catalyst is the REVEAL six-month pivotal interim and FDA BLA feedback in 1H27. Celcuity (CELC, +6.3%, 23.2% SI/SO) carries a valuation argument; its PIK3CA-mutant sNDA was submitted on Aug 26, in the prior window. For TSHA and CELC the flow is real and the attribution is inference.