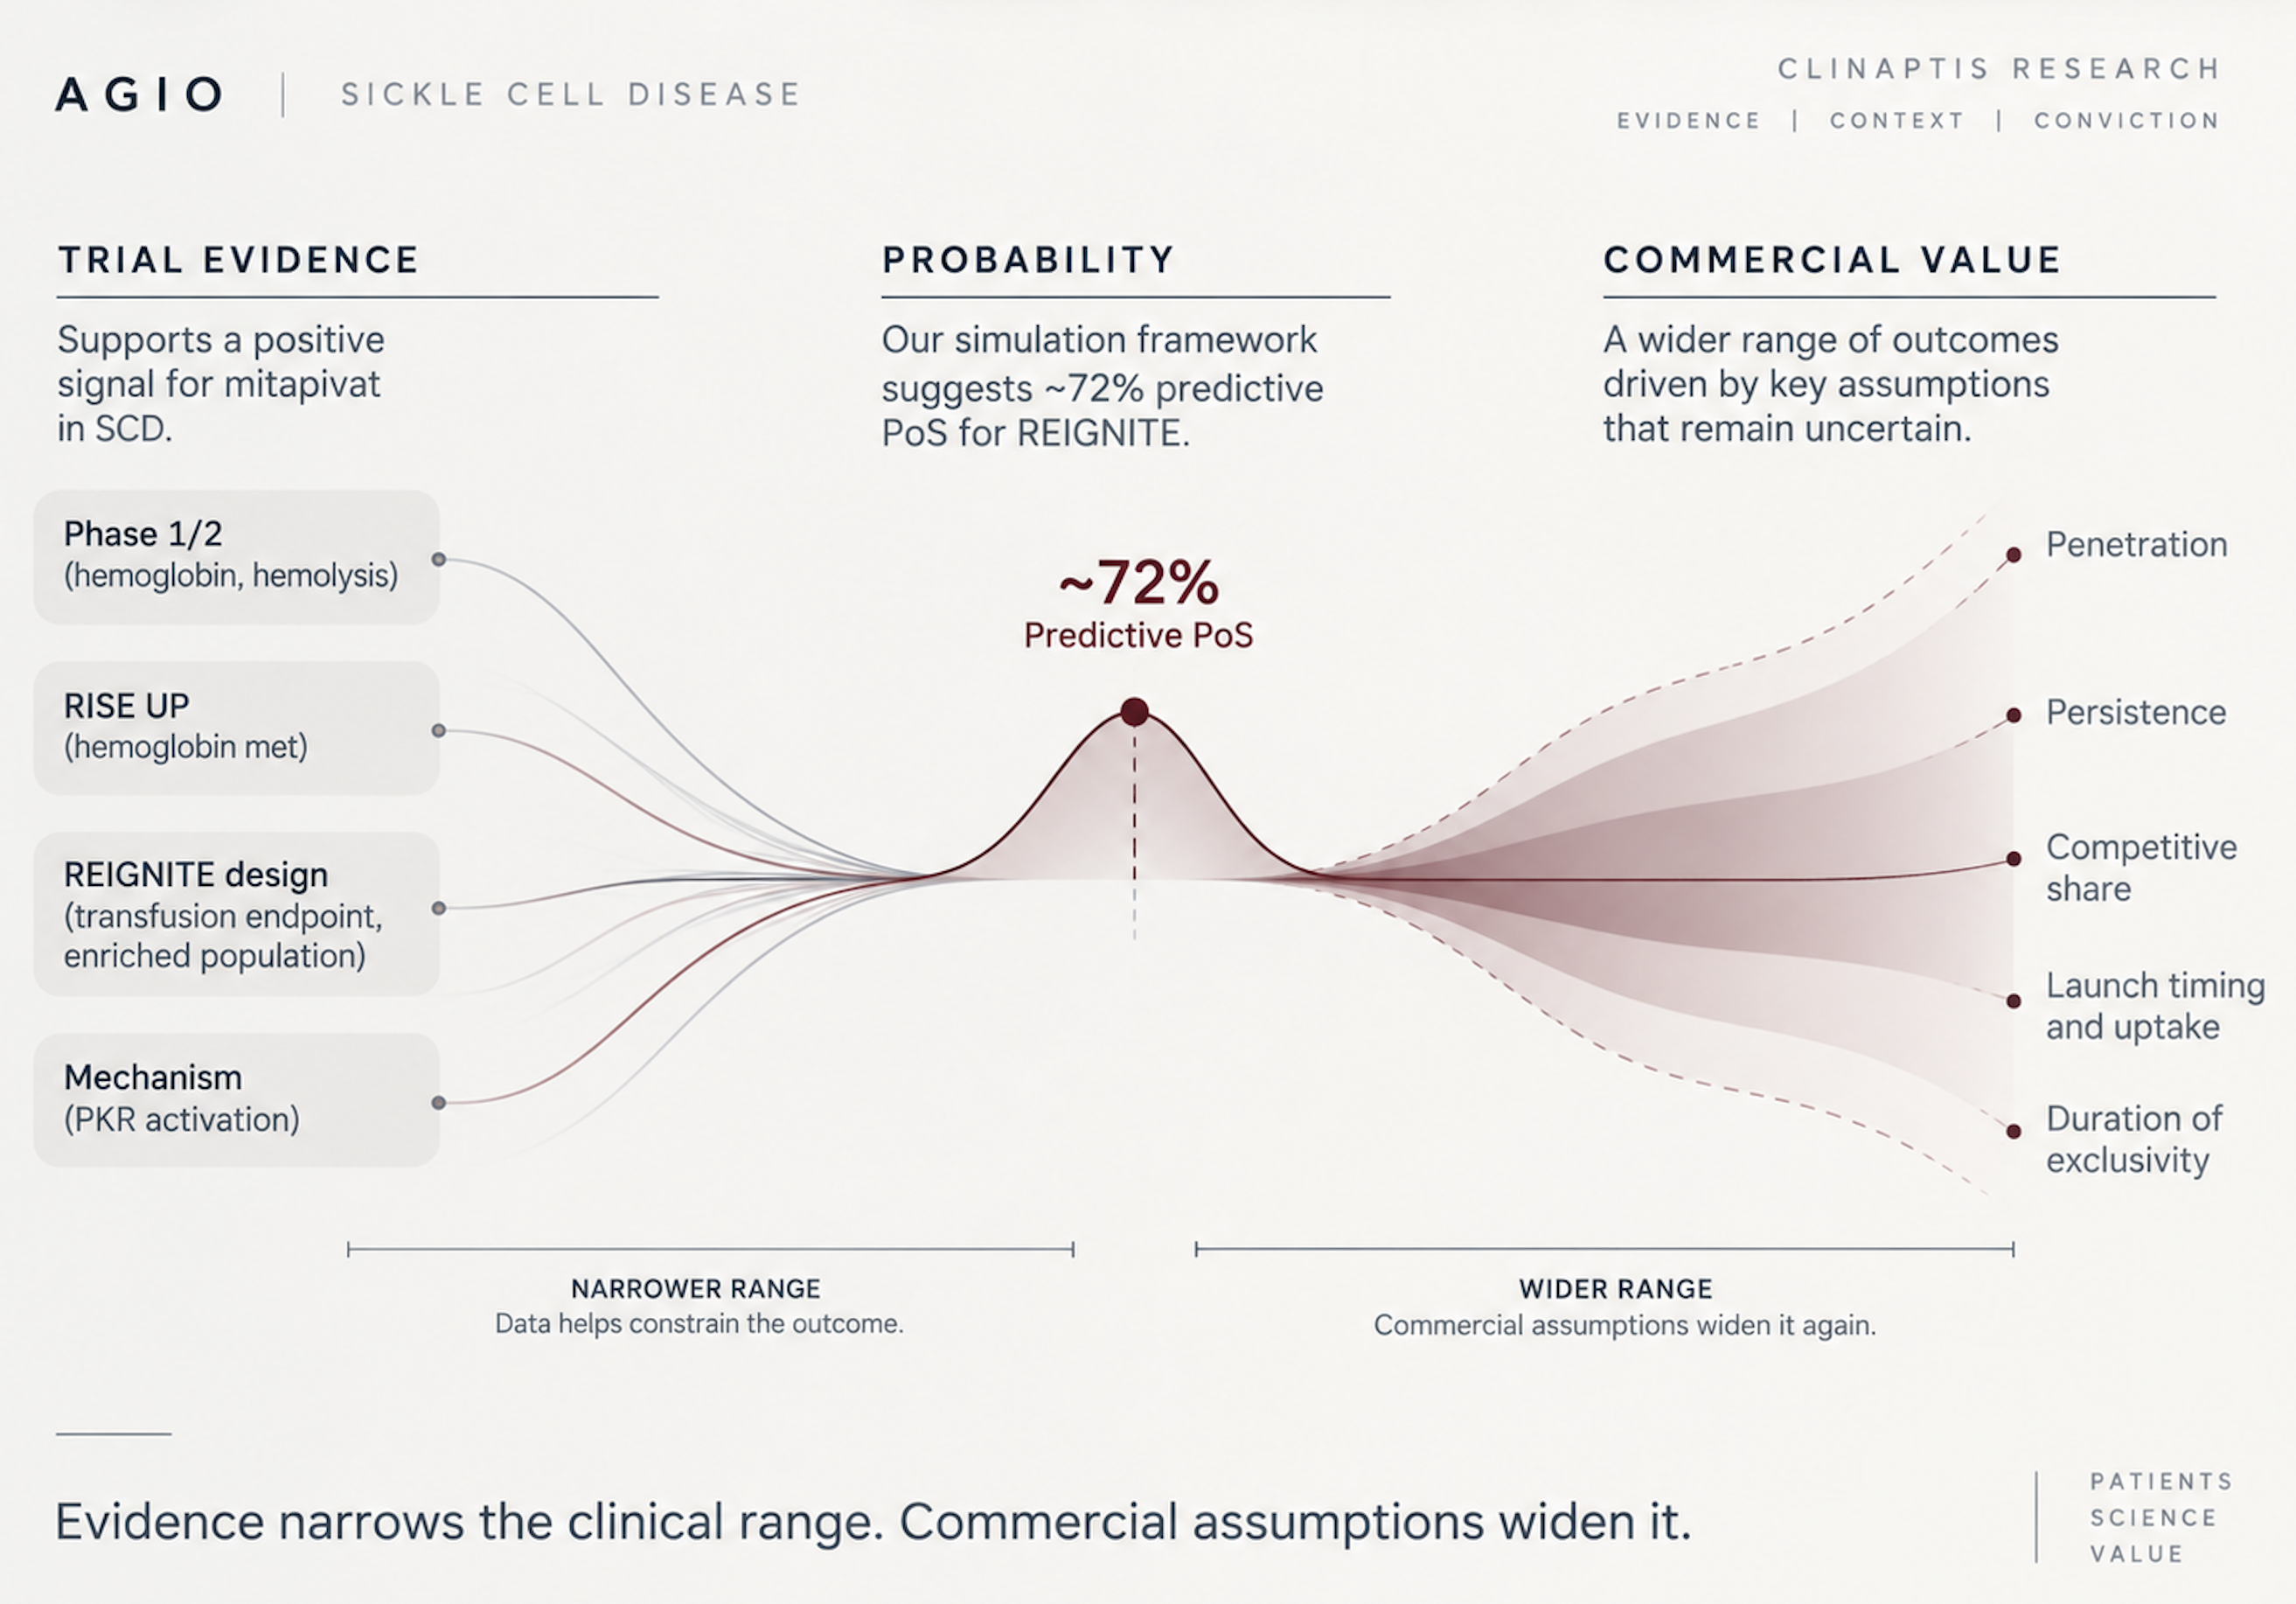
Our work supports ~72% predictive PoS for Phase 3 REIGNITE. The harder question is whether mitapivat can capture enough SCD share to justify $33/sh.
 Open full resolution ↗
It is unusual for a commercial SMID-cap biotech to hold nearly $1B of cash and no debt—roughly half its market value. Agios is one, yet the shares remain depressed after two readouts reset the SCD opportunity. Mitapivat, a PKR activator, is the company’s core commercial and clinical hematology asset, with approvals in PKD and thalassemia and a near-term label-expansion opportunity in sickle cell disease (SCD). RISE UP met its hemoglobin endpoint but missed the randomized pain-crisis co-primary in Nov 2025. Then, in Apr 2026, Novo Nordisk’s etavopivat, which targets a similar mechanism, hit both Phase 3 co-primaries, strengthening the case for superiority over mitapivat. More recently, Agios discontinued development of its next-generation molecule tebapivat in lower-risk MDS and SCD. The shares have since settled in the low $30s heading into the next major value inflection: the 1 Nov accelerated-approval decision for mitapivat in SCD.
The earlier Phase 1/2 mitapivat data in SCD were encouraging, with improvements in hemoglobin (Hb) and markers of hemolysis supporting the biological case for PK activation. RISE UP subsequently confirmed the Hb benefit in Phase 3, even as it missed on pain crises. The confirmatory REIGNITE study now gives mitapivat a cleaner second shot: it enrolls patients with prior transfusions and uses remaining transfusion-free through Weeks 4–52 as its primary endpoint, rather than pain crises.
We reconstructed the RISE UP transfusion data, modeled the enriched REIGNITE population, and simulated the Phase 3 trial across a range of plausible baseline transfusion rates and treatment effects. That work leaves us at ~72% predictive PoS for REIGNITE and a post-HIBISCUS SCD peak-sales range of ~$580–650M.
The harder question is valuation. SCD optionality is difficult to isolate in AGIO’s current share price, while valuing it independently from the bottom up requires assumptions around penetration, persistence, and competitive share that remain poorly observable. That tension—between a clinical outcome we think is reasonably predictable and a commercial outcome that is not—is the central question for the note.
1. Mitapivat finally reaches a market large enough to matter
Mitapivat’s commercial life began in a very different disease. In February 2022, the FDA approved PYRUKYND for hemolytic anemia in adults with pyruvate kinase deficiency, the first disease-modifying therapy for that ultra-rare disorder. The launch was predictably slow: $3.1M of US revenue in its first full quarter, and 56 patients on therapy by the end of the second.
That was not simply a failure of execution. PK deficiency required Agios to build the market while selling into it: find genetically defined patients scattered across hematology practices, educate physicians, establish treatment pathways and stand up the infrastructure of an ultra-rare-disease franchise. Mitapivat worked; finding and converting the patients was the harder commercial problem.
Thalassemia expanded the franchise without relaxing the constraint. The addressable US population is still small, and much of the opportunity sits internationally, where commercialization requires country-by-country reimbursement and infrastructure. Mitapivat was becoming a successful orphan-anemia franchise without yet becoming a large commercial asset.
Sickle cell disease changes the scale—and the competition.
While Agios was establishing mitapivat across orphan anemias, Novo Nordisk acquired Forma Therapeutics for $1.1B in 2022, and with it etavopivat, another oral PKR activator developed principally around SCD. The competitive question is therefore unusually clean: two drugs exploiting the same biological mechanism, arriving at SCD from different starting points. Agios brings the first approved PK activator and several years of commercial experience; Novo brings a molecule built around the much larger opportunity.
For mitapivat, SCD is more than another label expansion. It is the indication capable of changing the economic scale of the franchise, and the first in which Agios does not have the PK-activation field largely to itself.
2. The awkward anatomy of AGIO’s valuation
Three pieces sit inside AGIO’s valuation. The established PKD/thalassemia franchise is a high-margin commercial business. SCD is not yet a business. And the broader pipeline consumes substantial R&D without contributing explicit value in our model.
Nearly $1B of cash and marketable securities sits alongside all three. At $33.07, roughly half the market capitalization is therefore financial rather than operating, leaving about $1.09B of enterprise value for the businesses and pipeline to justify.
Even the established franchise requires a judgment call. Agios spends far more on R&D than is needed to support PKD and thalassemia alone, so assigning all corporate R&D to those products would understate their value. We instead value the franchise with the operating costs required to sustain it, including normalized R&D and SG&A. That produces a standalone value of ~$712M before the haircut applied in §7.
The remaining issue is pipeline spending. After separately costing PKD, thalassemia and SCD, we estimate roughly $111M a year of ongoing cash R&D supports the broader pipeline. We charge the present value of that spending against the SOTP — ~$329M, or $5.3/sh — but assign no explicit value to the assets it funds. This is deliberately conservative: the spending is observable, while the value of AG-181, AG-236 and future programs is not yet sufficiently defined to underwrite.
Which leaves SCD. Cash and the established franchise account for most of the current price, leaving roughly $380M, or ~$6/sh, for SCD and the broader pipeline before the adjustments in §7. But SCD is the only component capable of materially changing the scale of the franchise. Its value turns on three questions: Does REIGNITE confirm the transfusion benefit? How large is the addressable market? And what share can mitapivat sustain against etavopivat?
3. The evidence stack currently favors etavopivat
RISE UP settled whether mitapivat does something in sickle cell disease. The Phase 3 produced a clear hemoglobin separation — 40.6% response versus 2.9% on placebo — consistent with the Ph 1/2 improvements in Hb and hemolysis markers that preceded it. Biological activity was unquestioned.
But RISE UP did not deliver on clinical outcomes. The trial missed its randomized pain-crisis co-primary (2.62 vs 3.05 annualized; p=0.1213) and the fatigue endpoint. Underpowering is an unconvincing explanation: based on the assumed original design parameters, the trial accumulated ~1.63× the planned information. Hb clearly improved, but the placebo-adjusted mean gain was +0.74 g/dL, below the ≥1.0 g/dL responder threshold. Analyses showing fewer pain crises and hospitalizations among Hb responders are harder to interpret because response was determined after randomization; they do not overturn the randomized endpoint miss.
A Hb win in SCD is also not self-evidently durable. Voxelotor (Oxbryta) won accelerated approval on a Hb endpoint and was withdrawn in 2024 after post-marketing data reversed its benefit-risk. Mitapivat’s RISE UP result is a Hb-and-transfusion story sitting on a failed pain-crisis co-primary, which is why the confirmatory trial rather than the November decision carries the durable value.
Etavopivat then produced the result mitapivat did not. HIBISCUS gave Novo a randomized win on the endpoint mitapivat missed — a 27% reduction in annualized vaso-occlusive crises and a 48.7% vs 7.2% Hb response and a transfusion benefit reported as significant but numerically undisclosed.
None of that makes etavopivat the better drug, and nothing available establishes that it is. HIBISCUS and RISE UP are separate trials in different populations, and no head-to-head exists. A cross-trial comparison of effect sizes would therefore be premature and add little.
The narrower conclusion is that etavopivat has shown strong anemia and VOC results, including the randomized VOC outcome that mitapivat sought and missed.
Transfusions are the exception. In RISE UP, 23.9% of mitapivat patients required a transfusion versus 40.6% on placebo. The comparison was randomized, and Novo has reported a transfusion benefit with etavopivat without disclosing the numerical result. For now, transfusion reduction is therefore mitapivat’s clearest point of differentiation.
REIGNITE is designed to test that finding prospectively. The ~159-patient, 2:1 randomized trial uses transfusion-free status from Week 4 through Week 52 as its primary endpoint. The question is whether the 23.9% versus 40.6% separation seen in RISE UP reproduces in REIGNITE’s transfusion-enriched population.
4. REIGNITE looks better than the RISE UP pain miss implies
REIGNITE tests the one signal §3 left intact: the randomized transfusion effect. Approval on 1 Nov is the catalyst; durable value depends on that signal confirming.
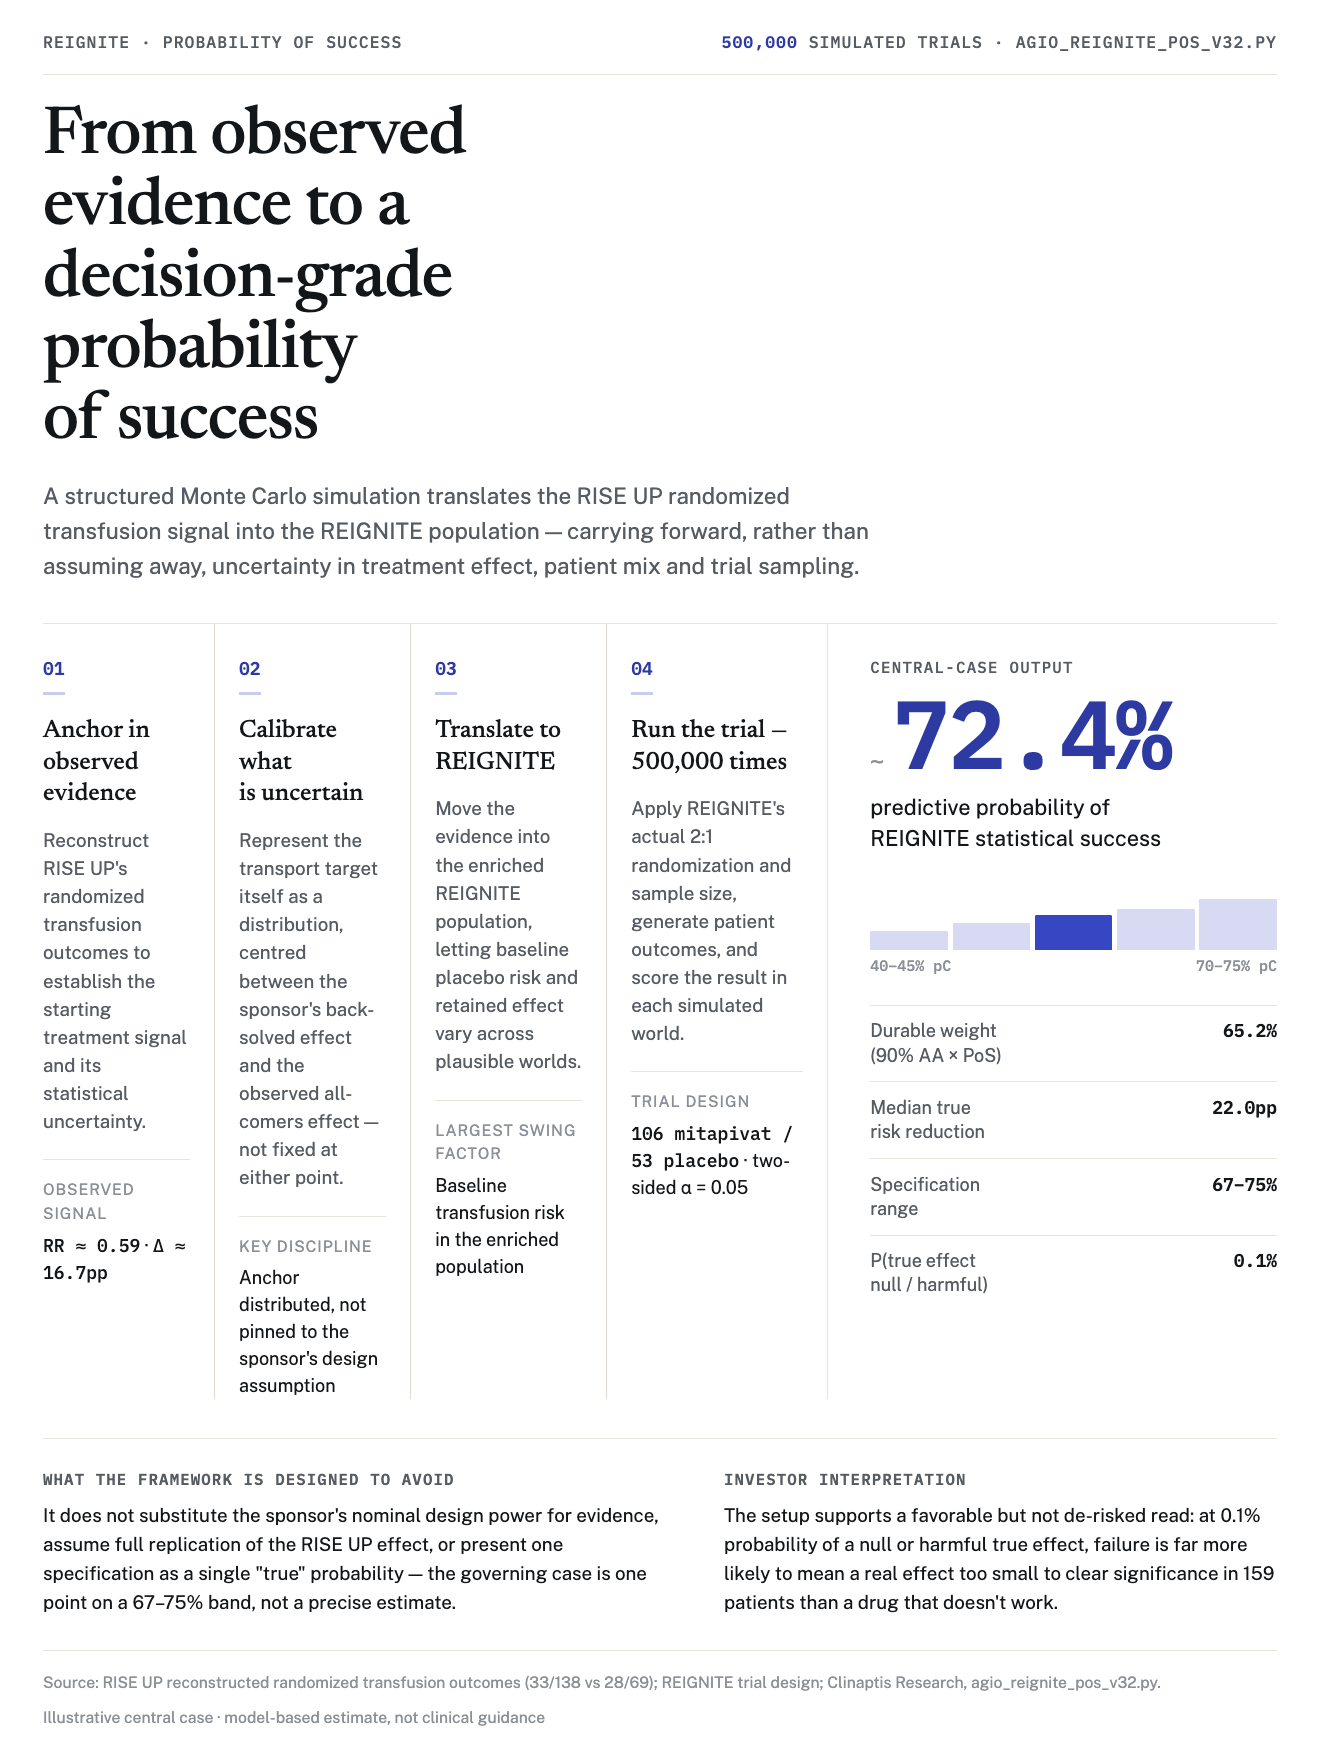
Sponsor design power is ~98%, nominal and conditional on a favourable assumed effect. Replay the trial on the observed all-comers RISE UP effect instead, and power falls to ~56%. Our model attenuates rather than assumes perfect replication and lands at ~72% predictive statistical PoS — a median true absolute transfusion-risk reduction of ~22pp.
The ~0.52 sponsor-implied relative risk is inferred from the 98% power claim, not observed subgroup data; we centre the transport assumption between that figure and the observed all-comers relative risk (0.59). Full parameterization is in Appendix A8.
We transport the effect on the log-RR scale: proportional effects combine naturally there, and attenuation moves the RR smoothly toward 1.0 — zero effect — rather than treating percentage-point differences as portable across populations with different baseline transfusion risk.
 Open full resolution ↗
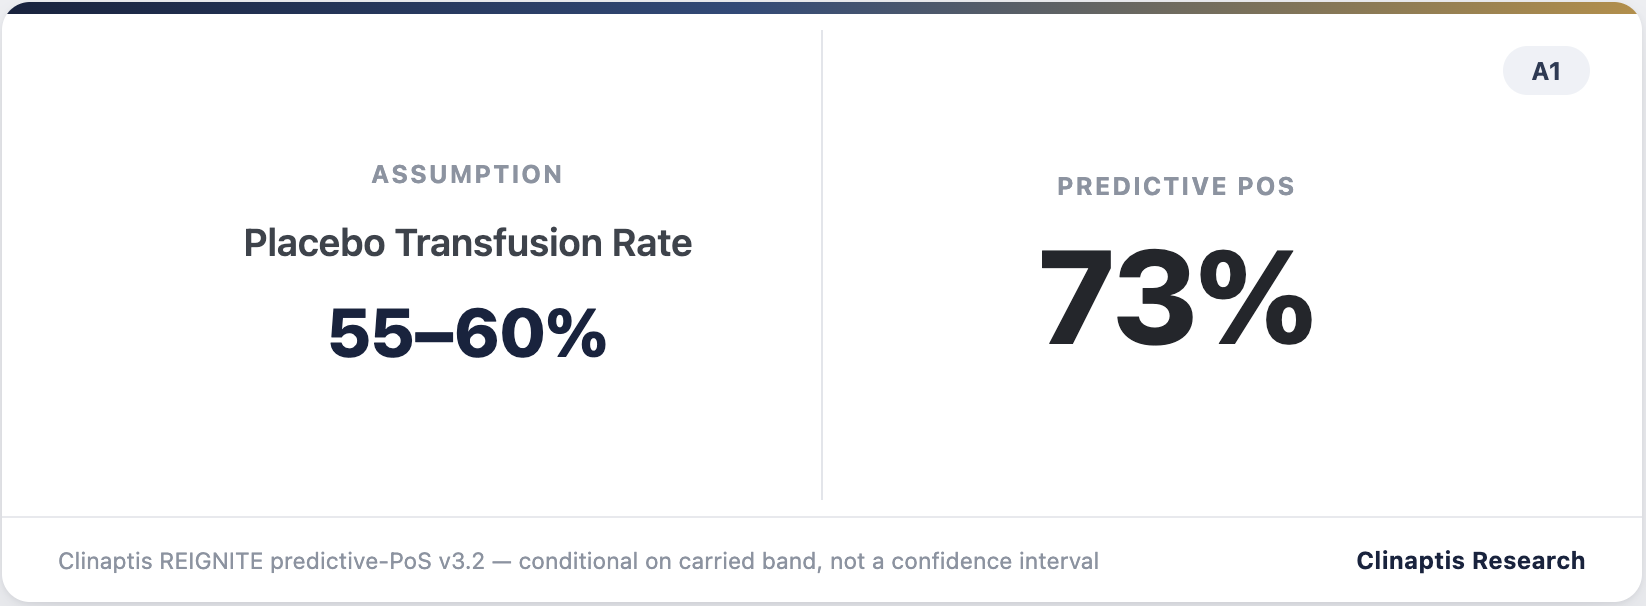
72% integrates across the full 40–75% placebo-rate prior; 73% is the conditional value at our carried 55–60% band. Across that prior, PoS spans 55–87% — more than any other input moves it, and the rate itself is undisclosed. That gap, not our model’s specification, is the dominant unresolved clinical input: the 67.5–75% transport-anchor range moves valuation by only ~$0.72/sh, an order of magnitude less. Full conditional table and simulation mechanics in Appendix A. What that PoS is worth is a question of reachable market and retained share — not of REIGNITE alone.
5. The addressable SCD market is much smaller than prevalence suggests
The ~100,000 US prevalence is not the market. SCD is commercially fragmented, undertreated and difficult to reach. Management’s ~25,000 US patients “actively treated or in need of therapy today” is a useful anchor, though it mixes current treatment with latent need. The ASH Research Collaborative Data Hub (22,793 patients, 14 US sites) reported just 19.8% receiving any DMT in 2023. We therefore carry a 20,000–30,000 commercial range, with 25,000 as the central anchor. Penetration, not prevalence, is the constraint and varies sharply by payer and site of care (Appendix A8).
The historical record is sobering: SCD prevalence has translated poorly into sustained branded patient-years. Oxbryta (GBT/PFE) took four years to reach $328M WW (FY23), and Adakveo peaked near $194M (Endari and Casgevy show the same pattern at smaller scale). Our post-HIBISCUS base of ~4,137 patient-years would already represent a substantial commercial footprint relative to prior branded SCD launches — particularly for mitapivat entering a two-drug PK-activator class.
We model the 23% standalone share phenotype by phenotype rather than assuming it outright (Exhibit 3): adoption is highest in severe-anemia and transfusion-burdened patients, then falls as mitapivat’s differentiation weakens across the segment mix. Break-even requires ~31% share, or ~1,787 additional patients. Alternatively, the practical pool would need to reach ~33,800 versus the 25,000 we carry. Either way, the additional patients have to come from somewhere concrete: severe-anemia prescribing share alone would need to rise from 35% to ~60% to close the gap.
Price cannot close the gap either. We carry ~$140k net per patient-year; break-even requires ~$189k, a +35% premium and above every list-price/gross-to-net combination we tested at 4,137 patient-years (Appendix Exhibit A3). >50% of US SCD patients are covered by Medicaid/CHIP, and management already expects SCD GTN above thalassemia’s 10–20% guide. Our ~30% GTN therefore does not look overly conservative — if anything, the realistic range may be higher (payer-mix and REMS detail in Appendix A8).
6. Competition shifts the problem from efficacy to retention
HIBISCUS changes the commercial question. On published evidence its anemia and VOC results are at least as strong as mitapivat’s — the case §3 already made. What HIBISCUS does not settle is mitapivat’s market share once both drugs are available.
A positive REIGNITE establishes transfusion benefit versus placebo. It does not establish superiority over etavopivat — no head-to-head is planned — or tell us what share mitapivat retains.
Retention, not REIGNITE PoS, is therefore the commercial hinge. Retention assumptions inherently carry uncertainty. No HIBISCUS transfusion event rates have been published, so the 80% and 85% we carry in severe anemia and transfusion-burdened patients rest on a phenotype argument, not on data. The blended-retention sensitivity sits in Appendix Exhibit A2 with the other one-variable break-evens.
Even 100% retention in mitapivat’s two strongest phenotypes (severe-anemia, transfusion-burdened) falls short with peak sales of $674M ~14% below the $781M break-even. Closing the gap requires holding the HU-inadequate and recurrent-VOC segments too, where etavopivat has the randomized win. Break-even requires ~97% blended retention against the 72% we carry.
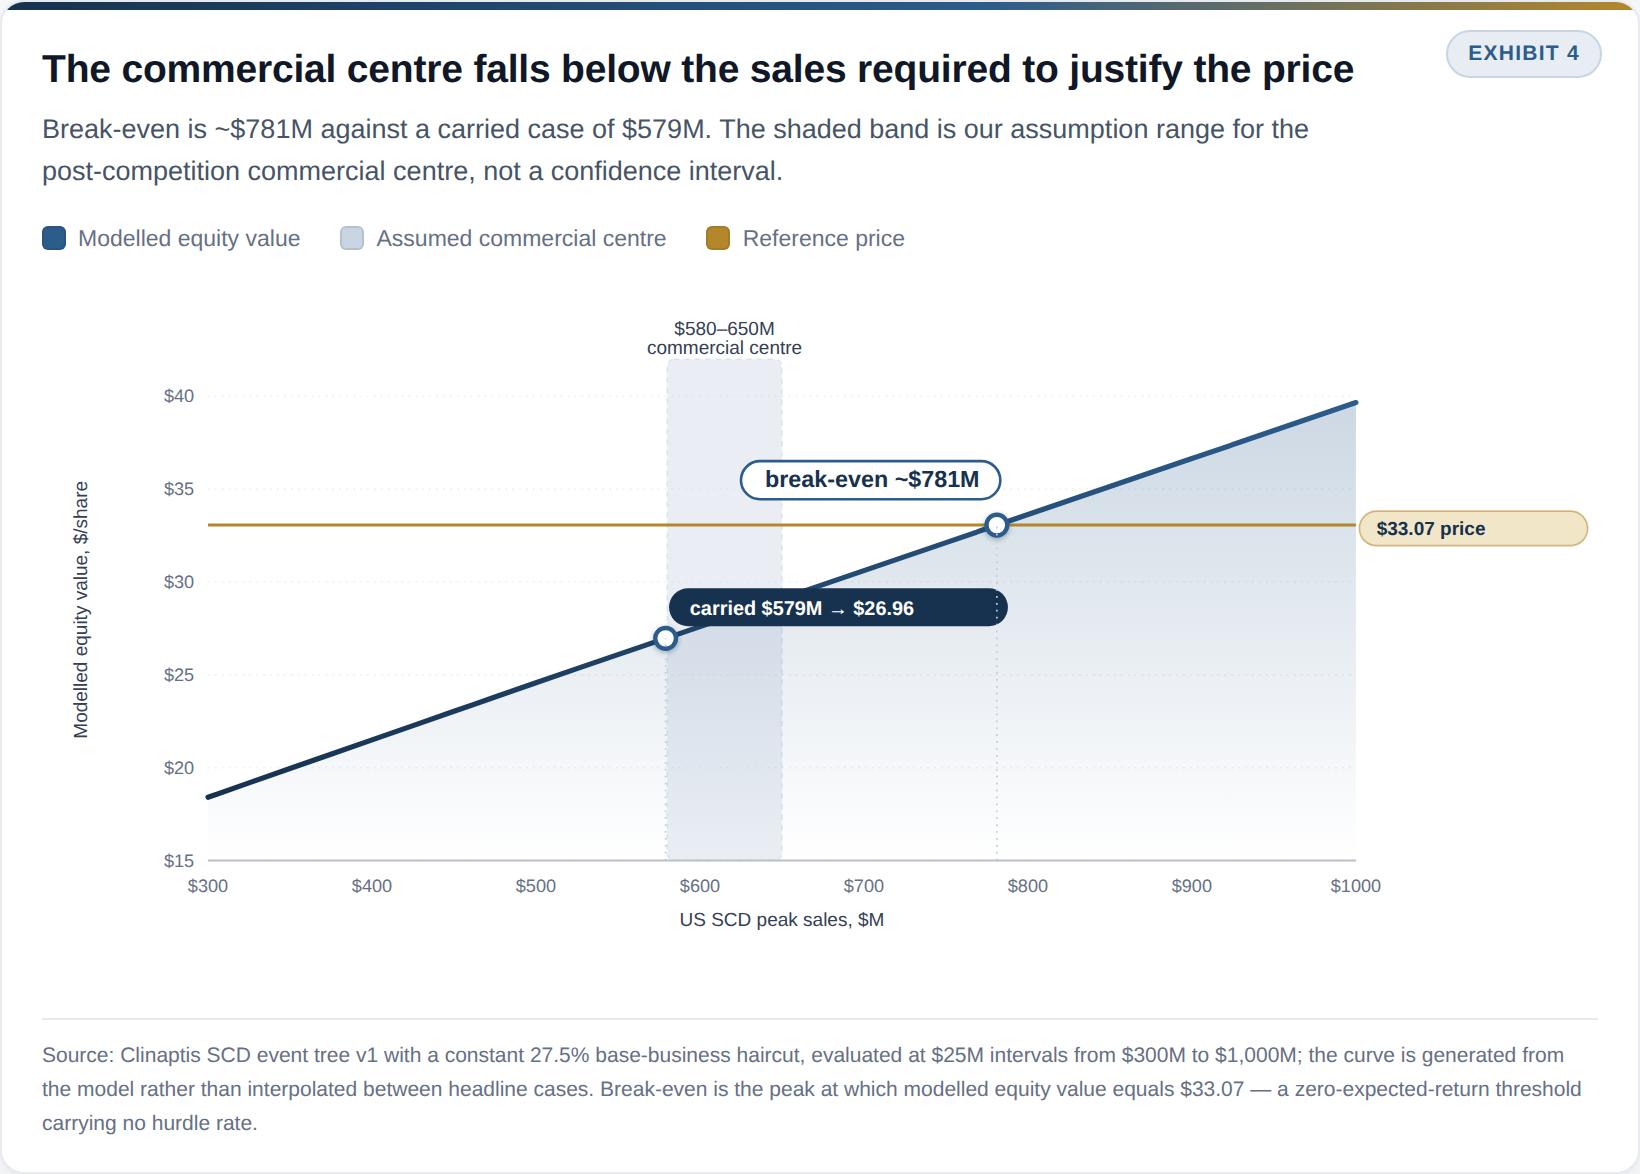
Our standalone SCD peak is $804M; the phenotype pressure test takes it to $579M, effectively the low end of our $580–650M commercial centre. $804M to $579M is the range competitive retention buys; $781M is what the price requires.
7. What the price requires
 Open full resolution ↗
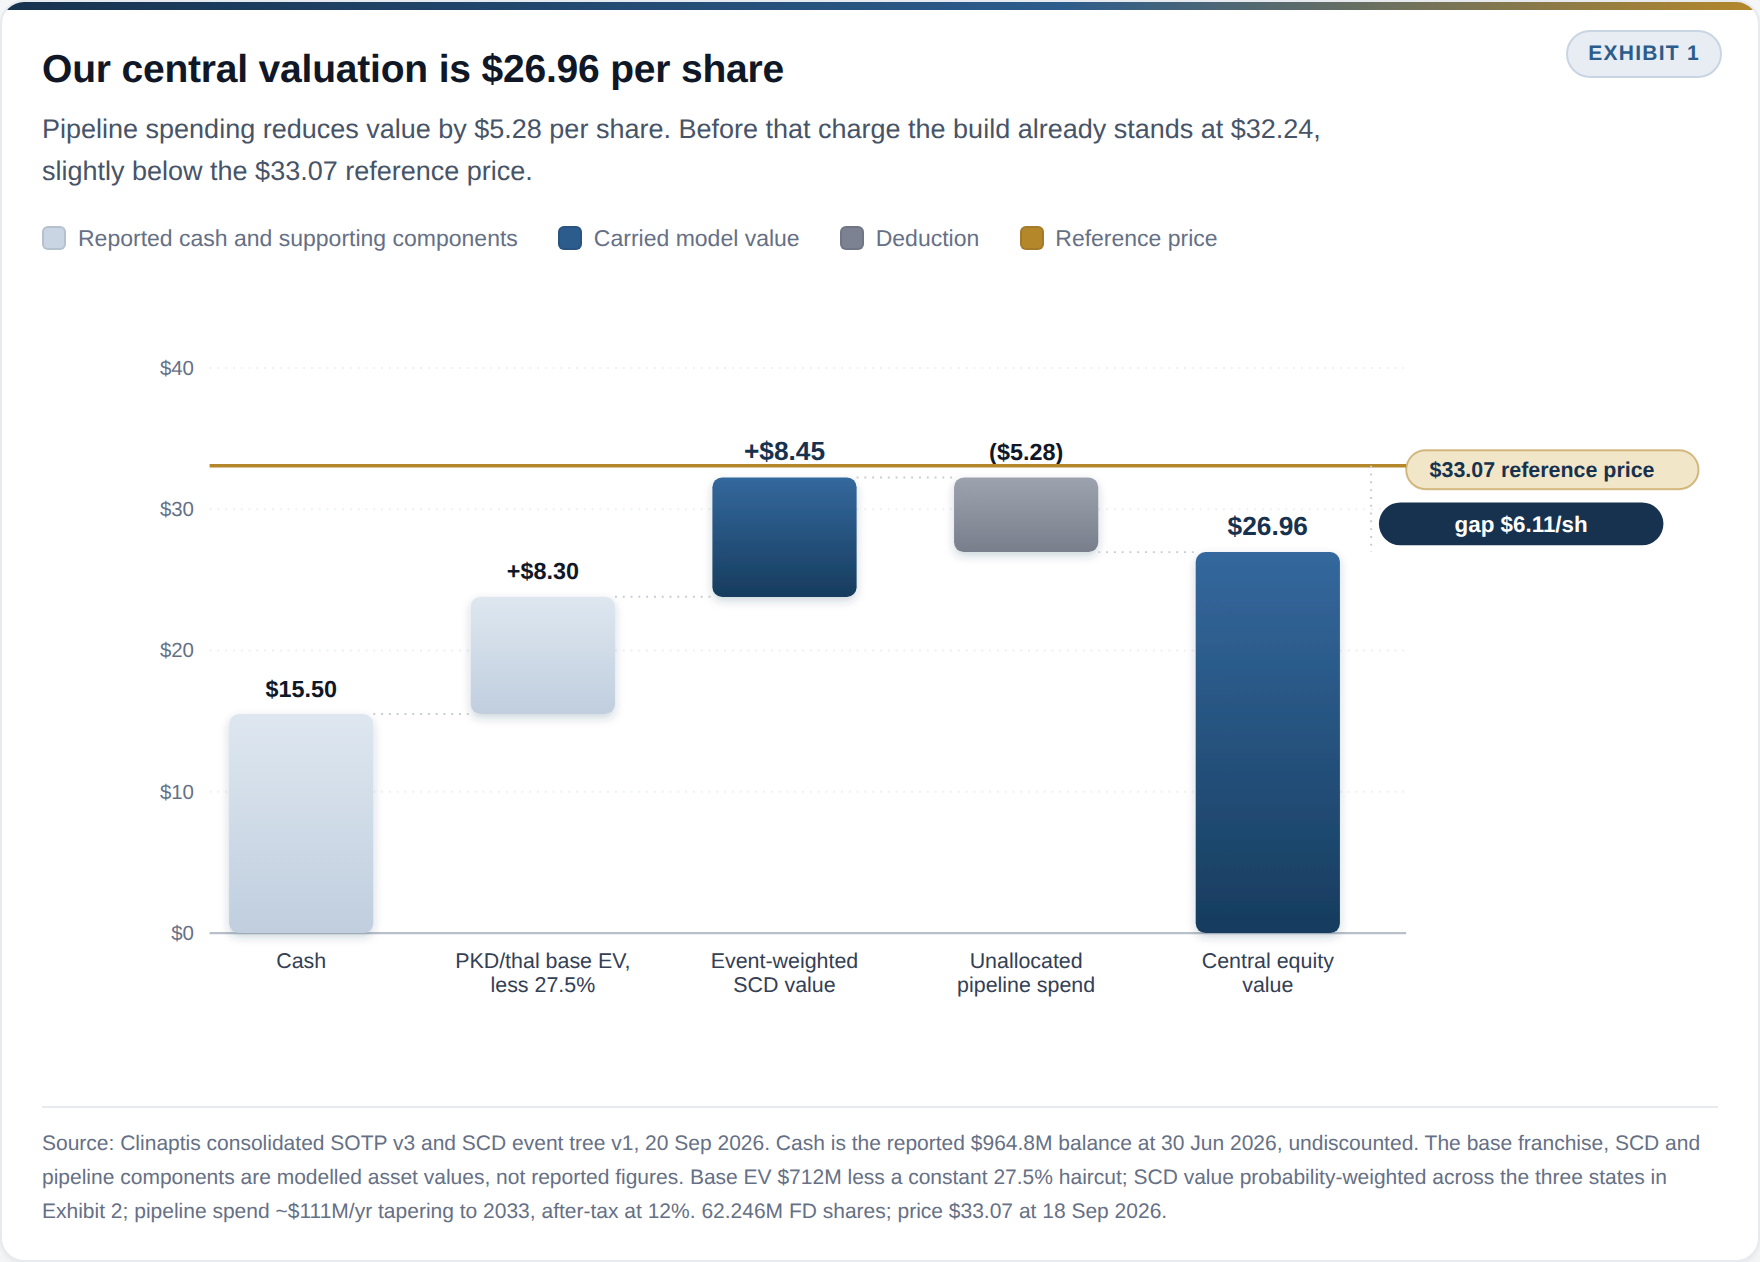
Our central SOTP is ~$27/sh against a $33.07 price. What does $33.07 require?
The reverse SOTP answers from the other direction. The ~$380M residual introduced in §2 is the simple enterprise-value remainder before our valuation conventions; once the 27.5% base-franchise haircut and ~$329M pipeline-spend charge established there are applied consistently, the current price implies roughly ~$906M for SCD versus our ~$526M. That measures the distance between the current price and our assumptions, not what the market actually believes — demanding, but not by itself evidence of mispricing either way. Our ~$781M SCD peak break-even is also only a zero-return threshold; a 15% required return demands materially more. One convention applies throughout what follows: the 27.5% base-business haircut and the event tree below are held constant across every sensitivity and break-even in this section.
We model approval and confirmatory risk separately. Costs are incurred before the outcome is known, while revenue earned before a later confirmatory failure does not disappear. A single probability applied to the whole DCF would misstate both.
The event tree’s flat-equivalent multiplier is ~66%. Gate timing has little valuation impact; the approval assumption matters more, but neither closes the gap on its own.
 Open full resolution ↗
Our ~$580–650M commercial centre (§6) remains below the ~$781M SCD peak required to justify the current price. Neither approval nor confirmatory PoS alone closes that gap under the other carried assumptions — each would need to exceed 100%.
Our ~$27/sh SOTP is deliberately conservative in places. Credit the full ~$712M base franchise established in §2 instead of our haircut, and the confirmatory PoS implied by today’s price falls from >100% to ~89%. The stock is not demonstrably expensive; it simply does not offer enough margin for unresolved commercial assumptions.
8. What would change our mind?
Three disclosures would move the valuation; none would resolve it.
-
RISE UP’s transfusion subgroup changes REIGNITE PoS. It is not yet public and may not become so before an FDA decision.
-
The numerical HIBISCUS transfusion result changes competitive retention. Novo has published only “significantly reduced,” with no event rates or hazard ratio disclosed (timing detail in Appendix A8).
-
The FDA label, REMS and list price change reachable patients and realized economics.
None answers the hardest question: how many steady state sickle cell disease patients would be treated with mitapivat, once both PK activators are available in market. Physician prescribing preferences, access and persistence become observable only after the launch (1H27).
We may simply be too conservative. The 25,000-patient pool is management’s, and historical DMT utilization may understate what an effective new launch can create. The 23% standalone share is built from phenotype assumptions with no external validation. Our $140k net per patient-year may prove low for a 2027 rare-disease launch. And we haircut a profitable base franchise while charging ~$5.3/sh of pipeline spending and assigning that pipeline no offsetting value. Take the plausible-but-favourable end of each — 30,000 practical patients, 85% retention and $160k net — and the bull scenario reaches ~$38/sh, +14%: a credible case, not a stretch built from absurdities.
The assumptions are not wrong so much as indistinguishable from our own given the evidence available, and +14% in a favourably constructed case is not compelling enough to underwrite several correlated commercial uncertainties at once. Scenarios we cannot distinguish with public data put fair value roughly $19–38, and $33.07 sits inside that range.
No position. Risk/reward is uncompelling at current levels. The clinical setup is cleaner than consensus thinks—our deep dive on REIGNITE suggests PoS is higher than the raw RISE UP read implies. But REIGNITE PoS isn’t the gating variable for owning the tape: commercial persistence, label language, and net realisable price are.
We are reluctant to underwrite low-visibility launch curves and retention metrics today, and are comfortable missing the initial de-risking pop and paying up on confirmation.
Re-entry Triggers:
-
Clinical: RISE UP subgroup signal or HIBISCUS transfusion read that expands REIGNITE’s edge.
-
Commercial: Hard label, channel, or early access data validating persistence and net price.
-
Valuation: Pullback to the ~$27 handle with thesis fundamentals intact (entry pivot, not a price target).
We did unusually deep work estimating REIGNITE’s predictive probability of success, and found it more likely to read out than the superficial RISE UP comparison implies — only to discover that REIGNITE PoS is not the variable that decides whether AGIO is worth owning. Retained share is, and it will not be observable until after launch.
Appendix
Sources
-
RISE UP Ph3 topline (Agios, 19 Nov 2025); stock reaction, Reuters.
-
HIBISCUS Ph3 topline (Novo Nordisk, Apr 2026).
-
Agios 2Q26 results and earnings call (Jul 2026); 2Q26 Form 10-Q.
-
ClinicalTrials.gov NCT07656415: REIGNITE design; no arm rates or SAP posted.
-
ASH Research Collaborative abstract 2312: 22,793-patient DMT utilization.
-
CDC SCD data; CMS Medicaid SCD program; SCD Implementation Consortium.
-
HRSA OPAIS; HRSA 340B requirements.
-
Tebapivat discontinuations: lower-risk MDS (May 2026); SCD Ph2 (Jul 2026).
-
Voxelotor (Oxbryta) SCD withdrawal (FDA / Pfizer, 2024).
-
Clinaptis internal: base-business DCF; consolidated SOTP v3; REIGNITE predictive-PoS v3.2; etavopivat pressure test.
Appendix A — Supporting exhibits
 Open full resolution ↗
A8 — Supporting diligence
Corporate cost reconciliation, 2026 ($M/yr). Actual recurring R&D 303 (2Q26 $100.8M less the $25M Oscotec upfront, annualized), less base-business model 100, less SCD model 35 = 168 unallocated; less ~22 non-cash stock compensation (pro-rata from ~$68M company-wide, allocated on modelled opex share), less 35 tebapivat (discontinued 2026, rolls off 2027) = ~111 ongoing cash pipeline R&D. Tapered linearly to zero over 2027–2033, taxed at 21% (spend shields consolidated taxable income), discounted at 12%: PV $329M = ~$5.3/sh. Recurring SG&A is ~206 against ~225 modelled — models over-provide ~19; left in. Sensitivity: flat through the forecast, PV ~$390M (~$6.3/sh); three-year stub, PV ~$125M (~$2.0/sh).
Note on the $100M above versus the $80M used elsewhere (§2, base-franchise DCF): these are deliberately different numbers answering different questions, not an inconsistency to resolve. The $100M here is a top-down allocation bucket — what corporate R&D this reconciliation credits to the base business when identifying residual, unallocated pipeline spend. The $80M is a bottom-up normalized-R&D assumption inside the standalone PKD/thalassemia DCF that produces the ~$712M franchise value — what that mature franchise needs to run itself, independent of how today’s actual $303M is being allocated. $100M is authoritative for this reconciliation (it is what the ~$111M pipeline charge and ~$329M PV are derived from); $80M is authoritative for the franchise DCF. Both are held as carried.
Gross-to-net, filing calibration. 1H26: $10.074M of revenue-deduction provisions against $65.491M net product revenue ⇒ ~13.3% aggregate accrual GTN (10.074/(65.491+10.074)). Versus 1H25, incremental provisions of $7.787M on incremental net revenue of $44.310M imply ~15.0%, dominated by the AQVESME launch but including PYRUKYND growth and ex-US mix. This is a portfolio accrual proxy, not product-specific realized GTN; the reserve roll-forward includes $0.483M of prior-year adjustments still needing reconciliation to the net-sales denominator. Consistent with management’s 10–20% thalassemia guide — not a read on SCD.
340B. NASCC reported 115 comprehensive member centers in Feb 2025, now 120+; HRSA OPAIS identifies covered entities at parent and child-site level. Cross-matching shows a center’s 340B affiliation — not whether a given prescription meets HRSA’s patient definition, is dispensed through a registered arrangement, or what share of brand claims gets a chargeback. (Medicaid and 340B duplicate discounts are prohibited.) The missing input is 340B-eligible claim share — a channel-check or claims-data question, not a directory join. Sensitivity: 0%/10%/20% total-script 340B share yields GTN of ~27.5%/30.5%/33.5%.
Access friction. In a 2020 series of 54 comprehensive-center Oxbryta patients, 65% obtained the drug (mean 45 days, range 0–118). At a second center, the top reason adults never started was inability to complete the application — the drug is dispensed through a few specialty pharmacies. Agios’s thalassemia launch (442 cumulative prescriptions by 30 Jun, REMS, ~75% of lives covered) shows it can run restricted distribution, but reads weakly into SCD: thalassemia is a ~4,000-patient, Medicare-weighted commercial population.
Price anchors, and why we carry $140k net. PYRUKYND’s ~$335,800/yr list (flat since 2022) and AQVESME’s $425,095 show Agios can command six-figure list pricing for a comparably rare, comparably severe indication — a ceiling, not an answer. Realized net price in SCD comes in well below list: Oxbryta’s ~$147k 2024 list nets to ~$96k for roughly 65% of payers by GBT’s own guidance; ICER puts Adakveo’s net near $96k despite an $85–113k dosing range — both compressed by the same Medicaid-heavy payer mix mitapivat will face. Endari’s $40,500 is the floor an undifferentiated therapy commands. We carry $140k net because mitapivat’s data — oral dosing, a randomized transfusion effect — support pricing above the Oxbryta/Adakveo precedent but below PYRUKYND/AQVESME list levels, since SCD’s payer mix won’t sustain thalassemia-grade net pricing. $140k is a judgment call between those two precedents, not a modeled output.
Event-tree mechanics. S1 (no approval) charges $271M of committed development spend a flat multiplier never sees; S3 (approval, confirmatory fail) retains $134M of pre-confirmatory revenue a flat multiplier would destroy. These nearly cancel: the tree’s flat-equivalent multiplier is ~66%, versus 72% in an earlier draft and ~65% from a mechanical two-node product — the closeness is coincidence, not validation.
Base-franchise sensitivity and pipeline-spend checks. At $220M SG&A and $100M R&D the franchise holds near $594M, swinging from ~$351M at $500M peak sales to ~$1.1B at $700M. The taper is the weakest link, and evidence cuts both ways: Agios discontinued tebapivat in two indications in 2026 while paying $25M upfront for cevidoplenib the same year — supporting redeployment over wind-down, and arguing for the harsher end of the taper range; we carry the middle case, a choice rather than a conservatism. Removing the historical Oscotec upfront from the recurring R&D baseline isn’t double-counted — it sits in historical cash, not forward flows — and forward business-development spend isn’t modelled at all. The SCD/base R&D split is bookkeeping, not a finding: the money is spent either way, and reallocating it barely moves the total. Non-cash compensation nets to zero — adding ~$68M/yr back to free cash flow is worth ~$393M, and the dilution funding it costs the same ~$393M.
REIGNITE predictive-PoS model. The enriched placebo transfusion rate is drawn from a Beta(3,3) on 40–75%, bounded by the all-comers rate (40.6%) at the floor and the separation the sponsor’s power claim implies at the ceiling; the symmetric shape has no evidentiary basis and this prior alone swings PoS from 55% to 87%. The transport weight is Beta(1.5,3), mean 0.33 — two-thirds of the effect stays anchored on the observed RISE UP result. Attenuation is bounded at 35% with a Beta(2,5), mean ~10%, applied to the log-risk-ratio. Where the transport anchor is centred moves the estimate far more than its distributional shape does: ~75% at the sponsor’s implied effect, ~72% at our agnostic centre, ~70% with no enrichment benefit, ~67% with no transport adjustment at all. Simulation: hierarchical Monte Carlo, RISE UP arm rates from Jeffreys posteriors, pooled two-sided 5% z-test at n≈106/53.
Payer-mix. We weight 50% Medicaid/CHIP at ~40% off list, 40% ordinary commercial at ~15% off, and 10% 340B-eligible commercial at ~45% off; blended GTN comes to ~30.5%, consistent with the ~30% carried above (see filing calibration). Pushing Medicaid to 55% (CMS: more than half of US SCD patients are Medicaid/CHIP-covered) takes the range to ~35–41%. No cell in the resulting list-price/GTN grid (Appendix Exhibit A3) reaches the $781M break-even at 4,137 patient-years.
Disclosure and exclusivity. Agios stops reporting REMS-certified prescriber/pharmacy counts after 3Q26 and doesn’t expect material SCD revenue in 4Q26 — narrowing the near-term disclosure window. On exclusivity, management cites a 2035 composition-of-matter claim; third-party Orange Book listings show later dates — drug-substance to November 2038, SCD method-of-use to July 2041 — unconfirmed against Agios’s own filings and exposed to a skinny-label challenge before either date. Our valuation curve declines from 2035 on assumed competitive entry; a later loss of exclusivity is upside the SOTP doesn’t carry.
Limitations. The event tree has no delay or CRL state distinct from outright failure, and no partial-label state; S1 credits zero residual value to a refiling path. Forward business-development spend isn’t modelled. The pipeline carries zero asset value while its spend is charged — a conservative convention, not a consistent one. P(approval) is judgmental and uncalibrated. Segment sizes, prescribing shares and retention rates are Clinaptis assumptions without external validation — and they’re the inputs the conclusion turns on.
Catalyst timing. Venue and timing for the HIBISCUS numerical transfusion result are unconfirmed: ASH has published general abstract-release dates of 4 Nov and 7 Dec 2026, and Novo has promised a 2026 conference presentation without naming ASH or committing to which analysis appears.