
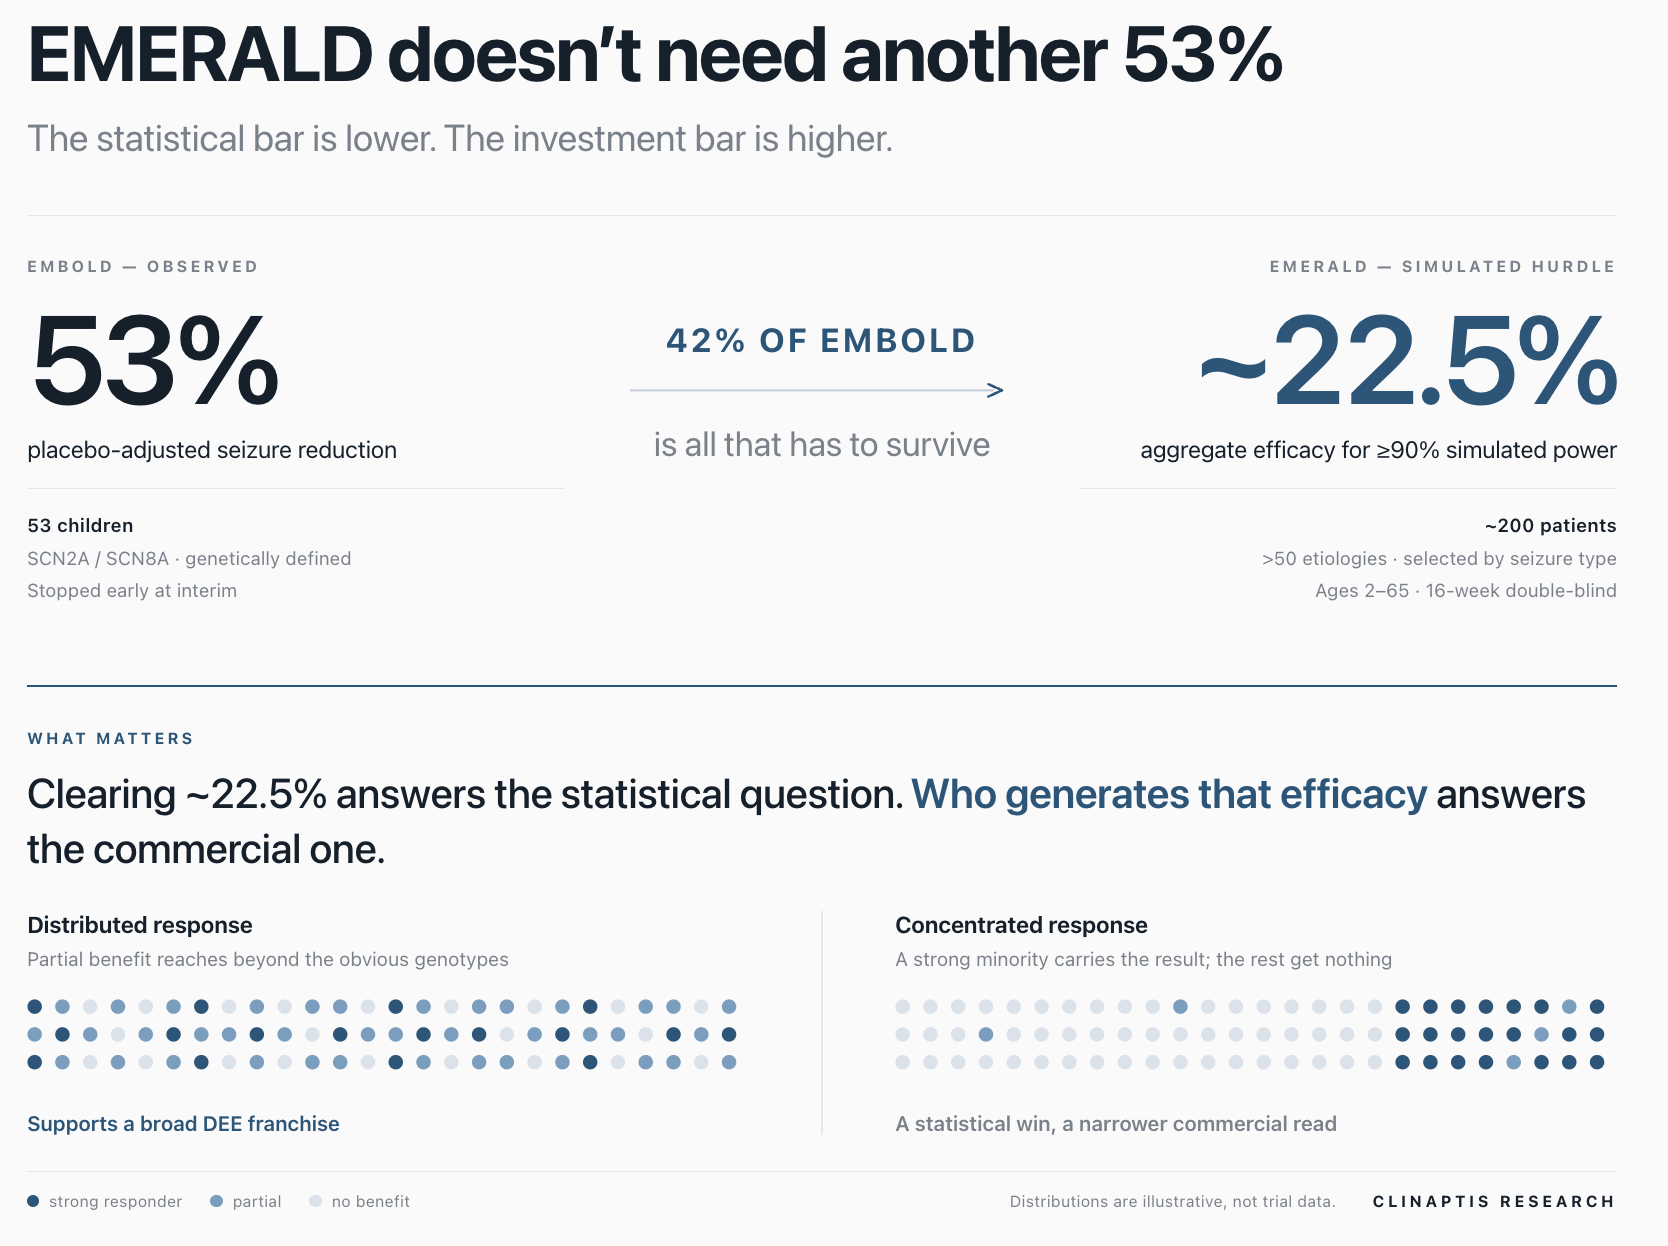
EMBOLD printed 53% in two genes. EMERALD needs roughly 22.5% across fifty. The clinical bar is lower than the market framing; the investment bar is higher than statistical significance, because what the stock is worth depends on who generates the reduction, not how large it is.
Praxis heads into an unusually compressed catalyst window. Relutrigine’s SCN2A/8A epilepsy decision falls Dec 27, 2026; ulixacaltamide’s essential-tremor (ET) decision follows barely a month later, on Jan 29, 2027: one PDUFA for each franchise that makes up nearly all of the company’s enterprise value. EMERALD’s top line (4Q guidance) data is expected ahead of both and will be critical in plans for label expansion into the broader developmental and epileptic encephalopathies (DEE), beyond genetically narrow SCN2A/8A. The stock has already discounted some of that uncertainty, down ~23% over the past month, though regulatory decision delay also factored in.
We anchor our due diligence on one central question: what does EMERALD need to show to earn broad DEE a third pillar in the valuation, rather than a narrower SCN2A/8A franchise plus an option.
Relutrigine is a next-generation, functional sodium-channel modulator from the same discovery platform as ulixacaltamide, which carries 70% of enterprise value in our published ET model. In EMBOLD, relutrigine reduced seizures by 53% vs. placebo in a trial stopped early (53 children with SCN2A- and SCN8A-related epilepsy), the data set supporting the Dec PDUFA. EMERALD is a different test: it enrolls by seizure type across more than 50 causes of DEE, asking whether enough patients across that far more heterogeneous population retain the same sodium-channel sensitivity.
Across placebo-calibrated simulations of a ~200-patient trial, the placebo-adjusted efficacy hurdle is ~22.5% across the whole population — the point at which every calibrated environment clears 90% power on our primary analysis, not a regulatory threshold and not a cliff. That is 42% of what EMBOLD reported (ratio: 22.5/53).
 Open full resolution ↗
1. What EMERALD Has to Clear
Five conclusions from the simulation work. The rest of the note is the evidence.
The bar is roughly 22.5% placebo-adjusted efficacy across the whole trial, not another 53%. (§3)
EMERALD clears it on breadth, not depth. A minority responding strongly isn’t enough on its own; patients who respond partially do most of the work. (§4)
The biology makes that mixture plausible. It cannot tell us how common it is in EMERALD. (§5)
Praxis hasn’t disclosed the primary analysis. One plausible choice fails on our own base case. (§6)
At today’s price, broad DEE is already carried close to what we think it’s worth. The readout is about magnitude, not direction. (§7)
2. How Much of EMBOLD Actually Carries Over?
EMBOLD’s registrational cohort (Cohort 2) randomised 53 children with SCN2A- and SCN8A-related epilepsy and reported a 53% placebo-adjusted reduction in seizures — a back-transformed rate ratio of ~0.47, not a median patient reduction. The result is real, but three characteristics weaken it as a ‘depth prior’ for EMERALD. The placebo comparison was small and staggered rather than parallel, so the headline was not measured the way EMERALD’s will be. The trial also stopped early, at an interim analysis for efficacy; early stopping controls false-positive risk but can inflate the observed effect, and since the stopping boundary and adjusted confidence interval aren’t public, the inflation can’t be quantified. And the cohort was narrow: predominantly SCN8A, 99% with seizure onset within twelve months of birth.
We use three depths as a result: 53% as observed, 46% as our central case (what the first EMBOLD cohort reported, not an arbitrary haircut), and 40% as a stress case (an assumption, not an estimate of early-stopping bias). All three describe response depth where the biology is most favorable — none is a forecast of EMERALD’s headline.
EMBOLD can’t be extrapolated directly. EMERALD enrolls about 200 patients aged 2 to 65, selected by seizure type rather than gene. Topline is guided to the fourth quarter.
EMBOLD therefore supplies the depth prior; EMERALD decides how widely that depth is spread. Management counts roughly 10,000 US patients in the genes already tested and 200,000 to 400,000 in the broader population EMERALD addresses, and assigns relutrigine more than $5B of peak-sales potential across both — company figures, not ours.
3. What Does EMERALD Need to Show to Work?
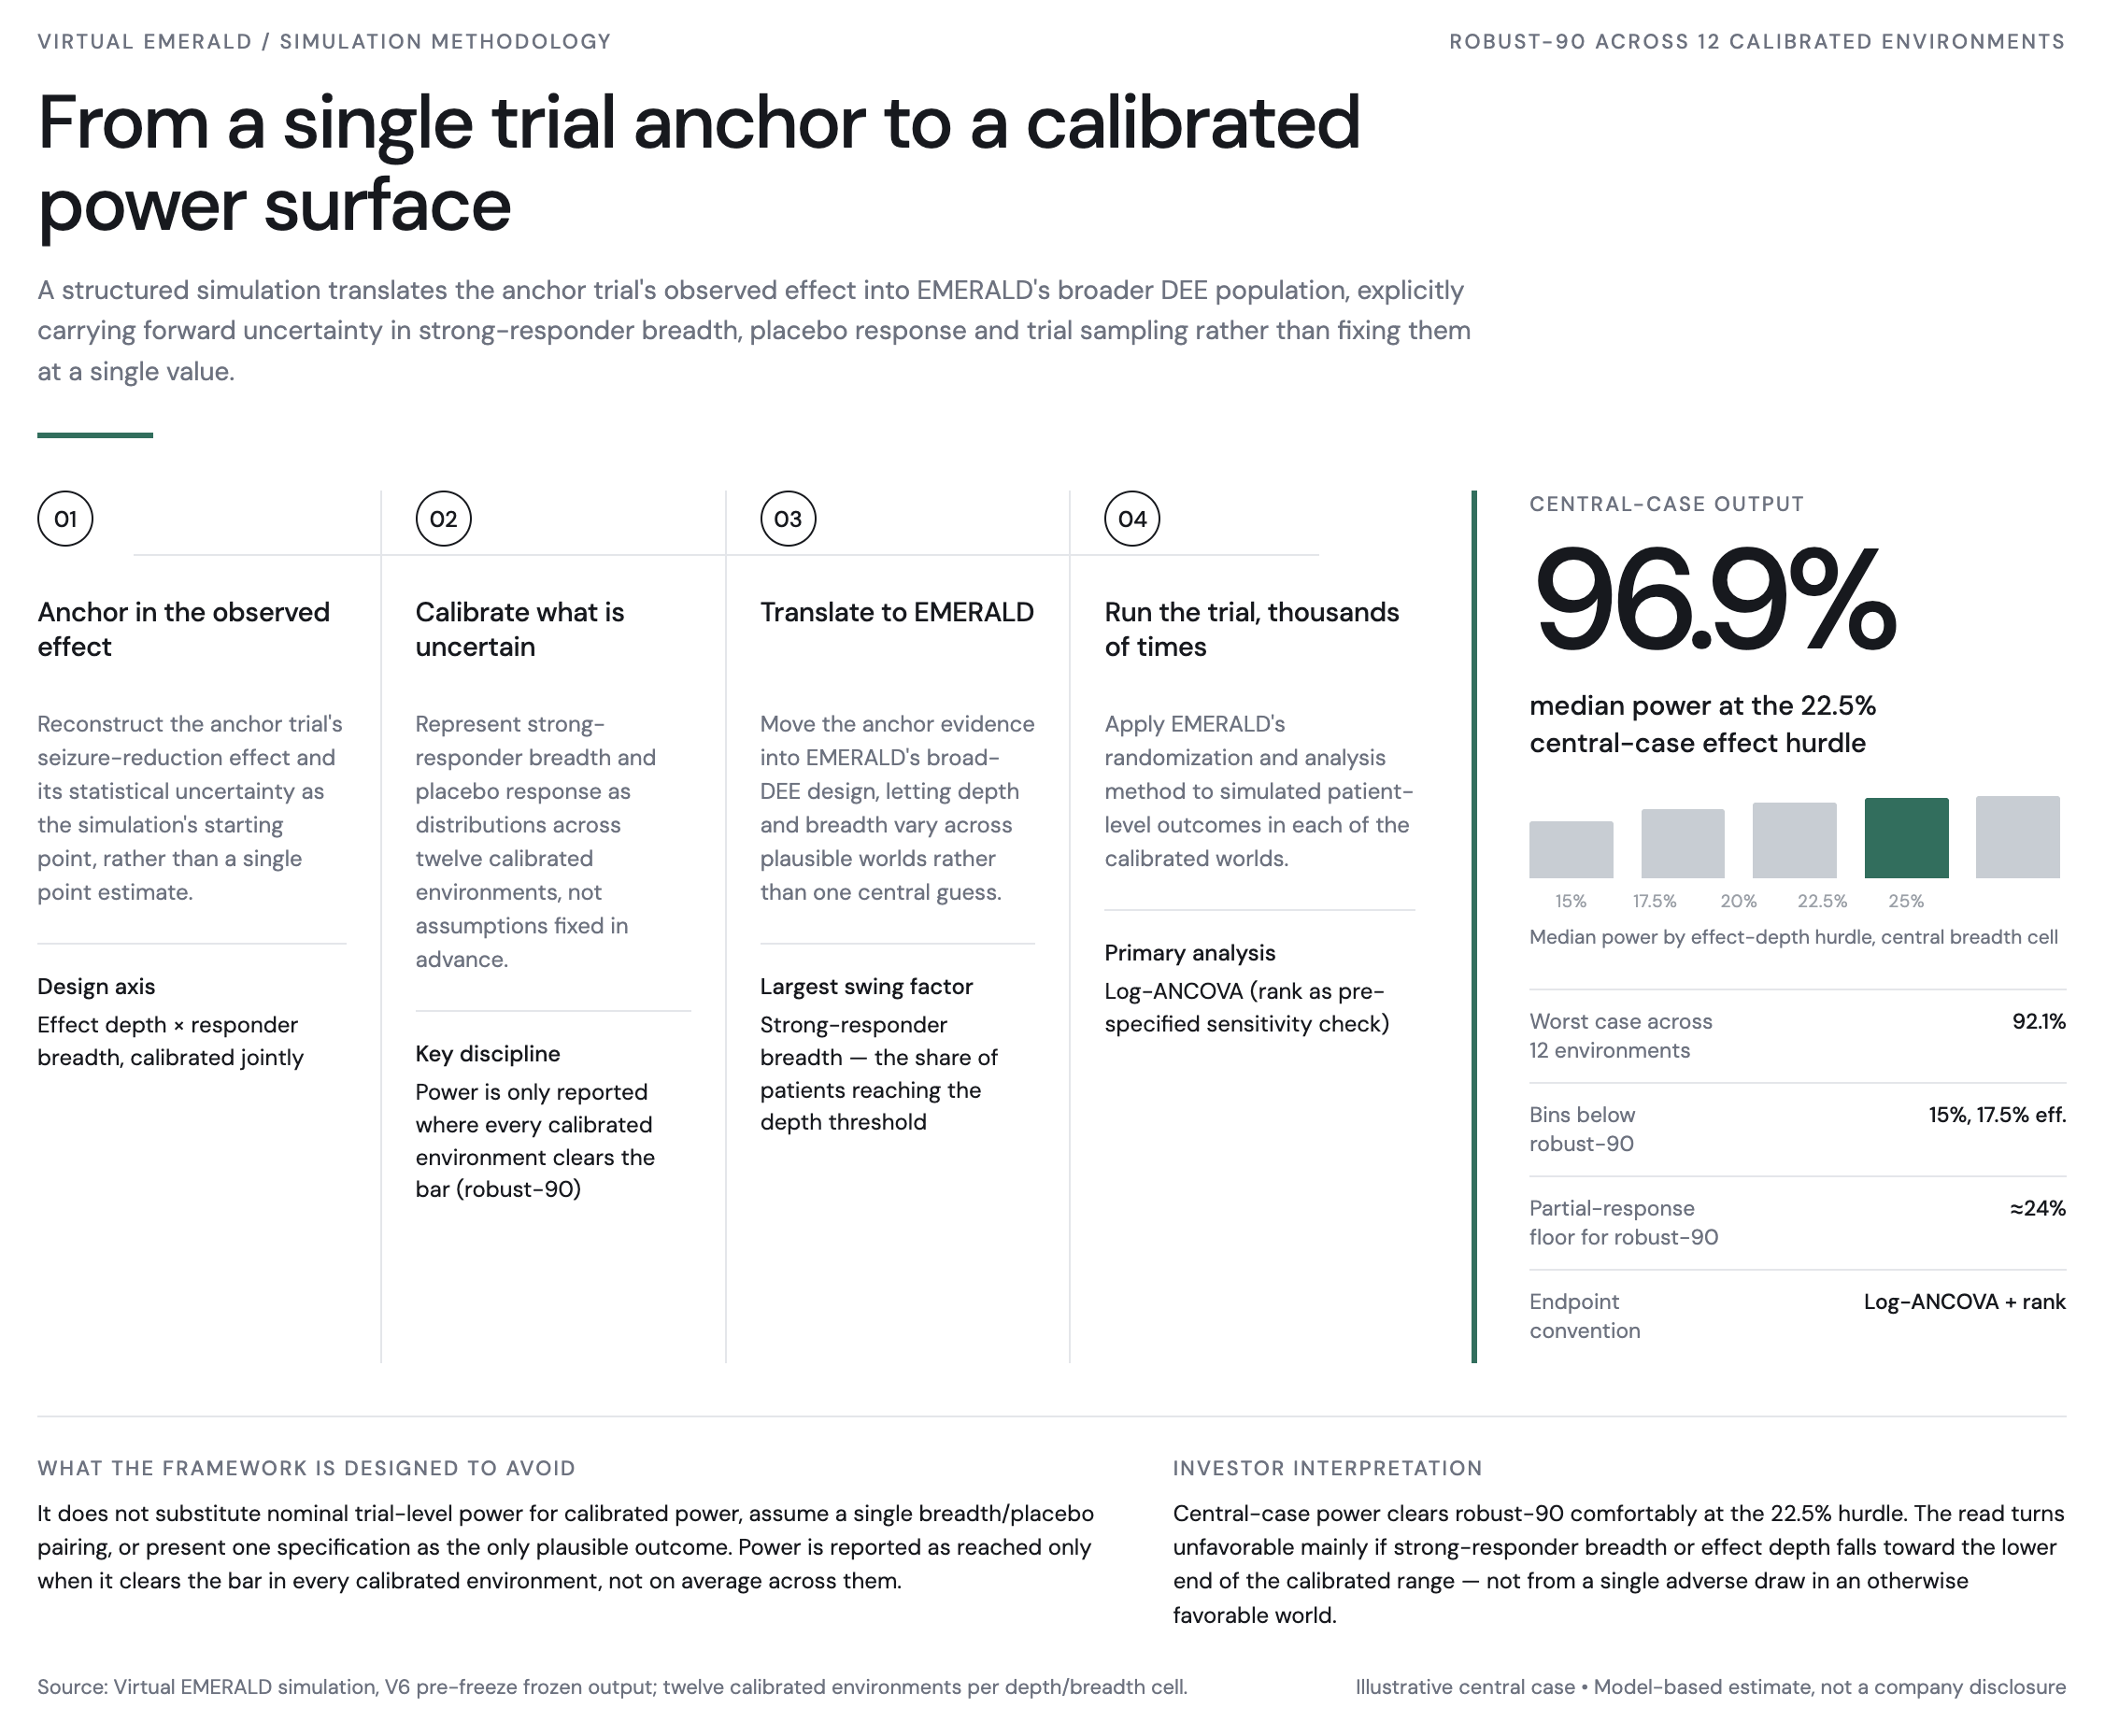
The ~22.5% hurdle comes from simulating the trial rather than from a power calculation on paper. We built a 200-patient version of EMERALD, gave it the seizure-count behaviour seen in comparable populations, and ran it thousands of times across 12 different assumptions about how variable those populations are and how much placebo patients improve. In our calibration placebo patients improve by roughly 18%, in line with the only comparable broad-DEE control arm on record: PACIFIC’s placebo moved about 17%.
At 22.5%, simulated power clears 90% in every one of the twelve environments (96.9% median, 92.1% weakest). Below that it decays quickly; the full ladder is in the Appendix. The transition is gradual, not a cliff: between 17.5% and 22.5% the trial moves from unreliable to robust, so small differences in the true effect matter more here than in a cleaner indication.
The Pbo arm does a lot of that work. Management has argued that EMERALD’s unusually high baseline seizure counts make placebo improvement unlikely; pooled Dravet data don’t support that — baseline rate did not predict percentage change.
This isn’t a probability that EMERALD succeeds — it’s the probability of success if the drug delivers 22.5%. Whether it does is a separate question, one of biology and trial composition, and that’s what breaking 22.5% into responder count and depth (next) is for.
4. How Many Patients Have to Respond, and by How Much?
EMERALD’s biological translation depends on two variables: response depth and response breadth.
-
Response depth: how much of the effect survives in the patients the drug should work in.
-
Response breadth: what share of EMERALD those patients are.
Treating “does 53% transport” as a single question conflates the two.
The depth-breadth trade off is bounded by three data points, none a forecast:
-
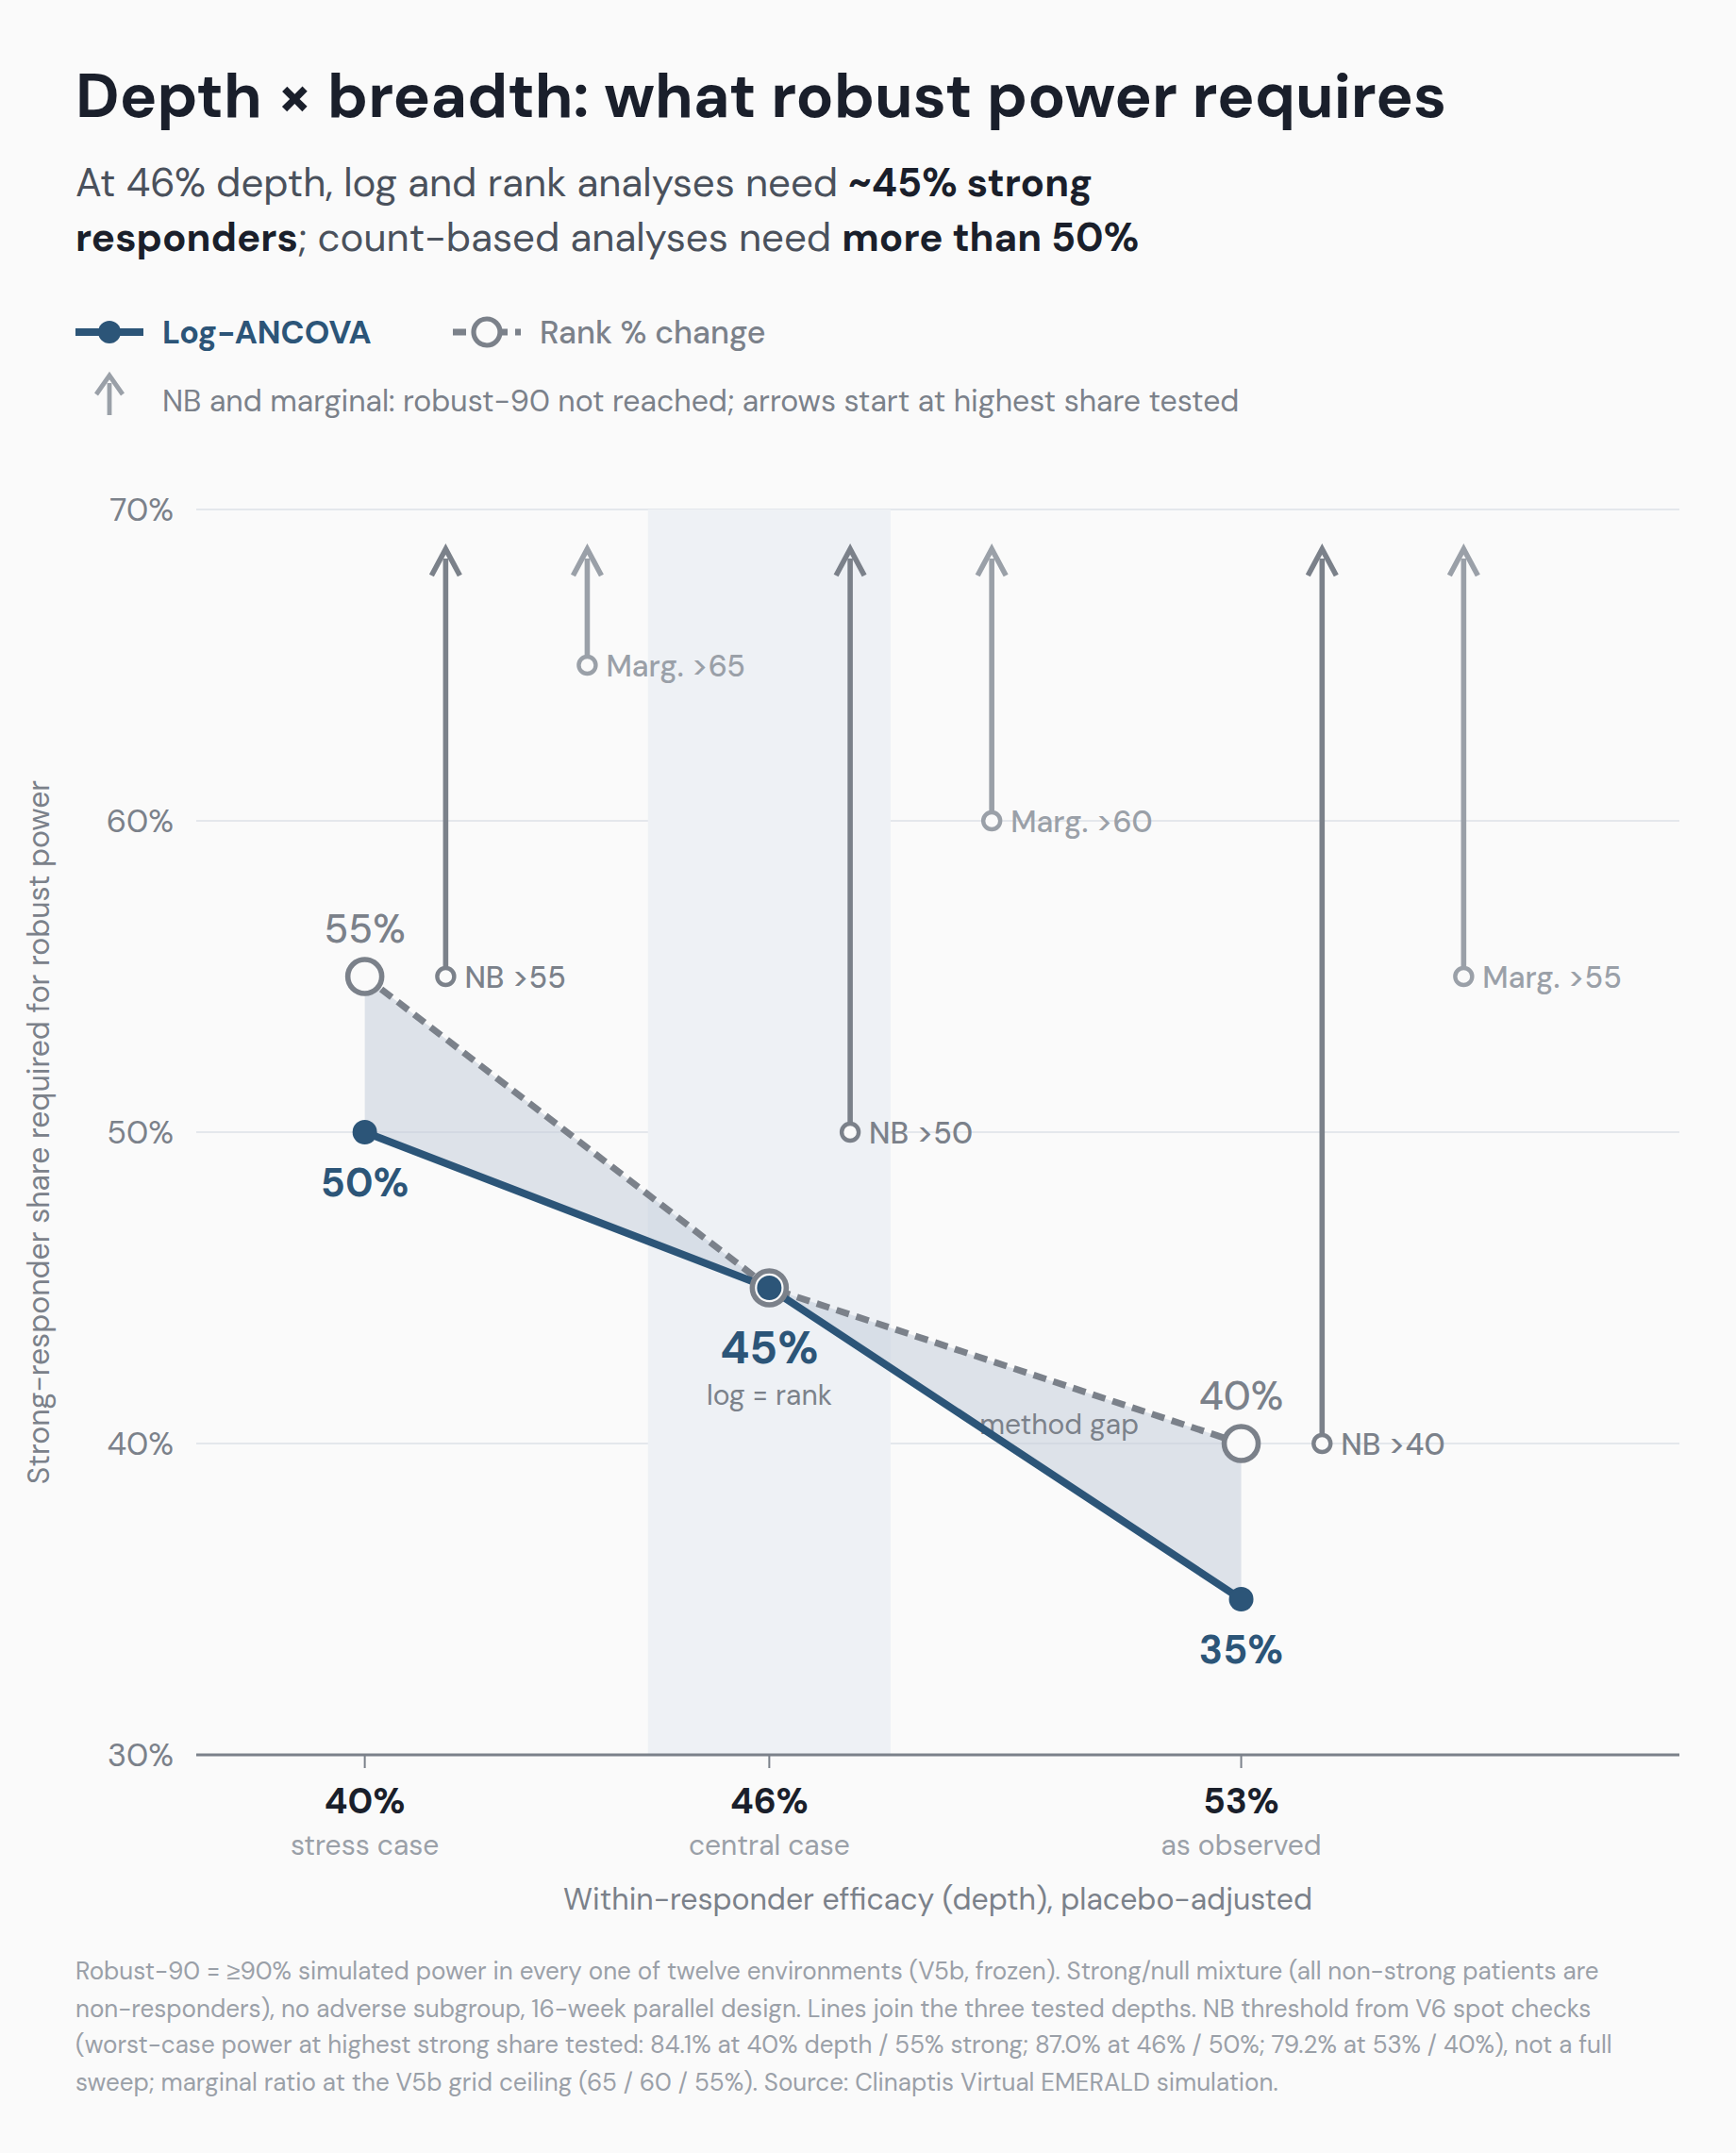
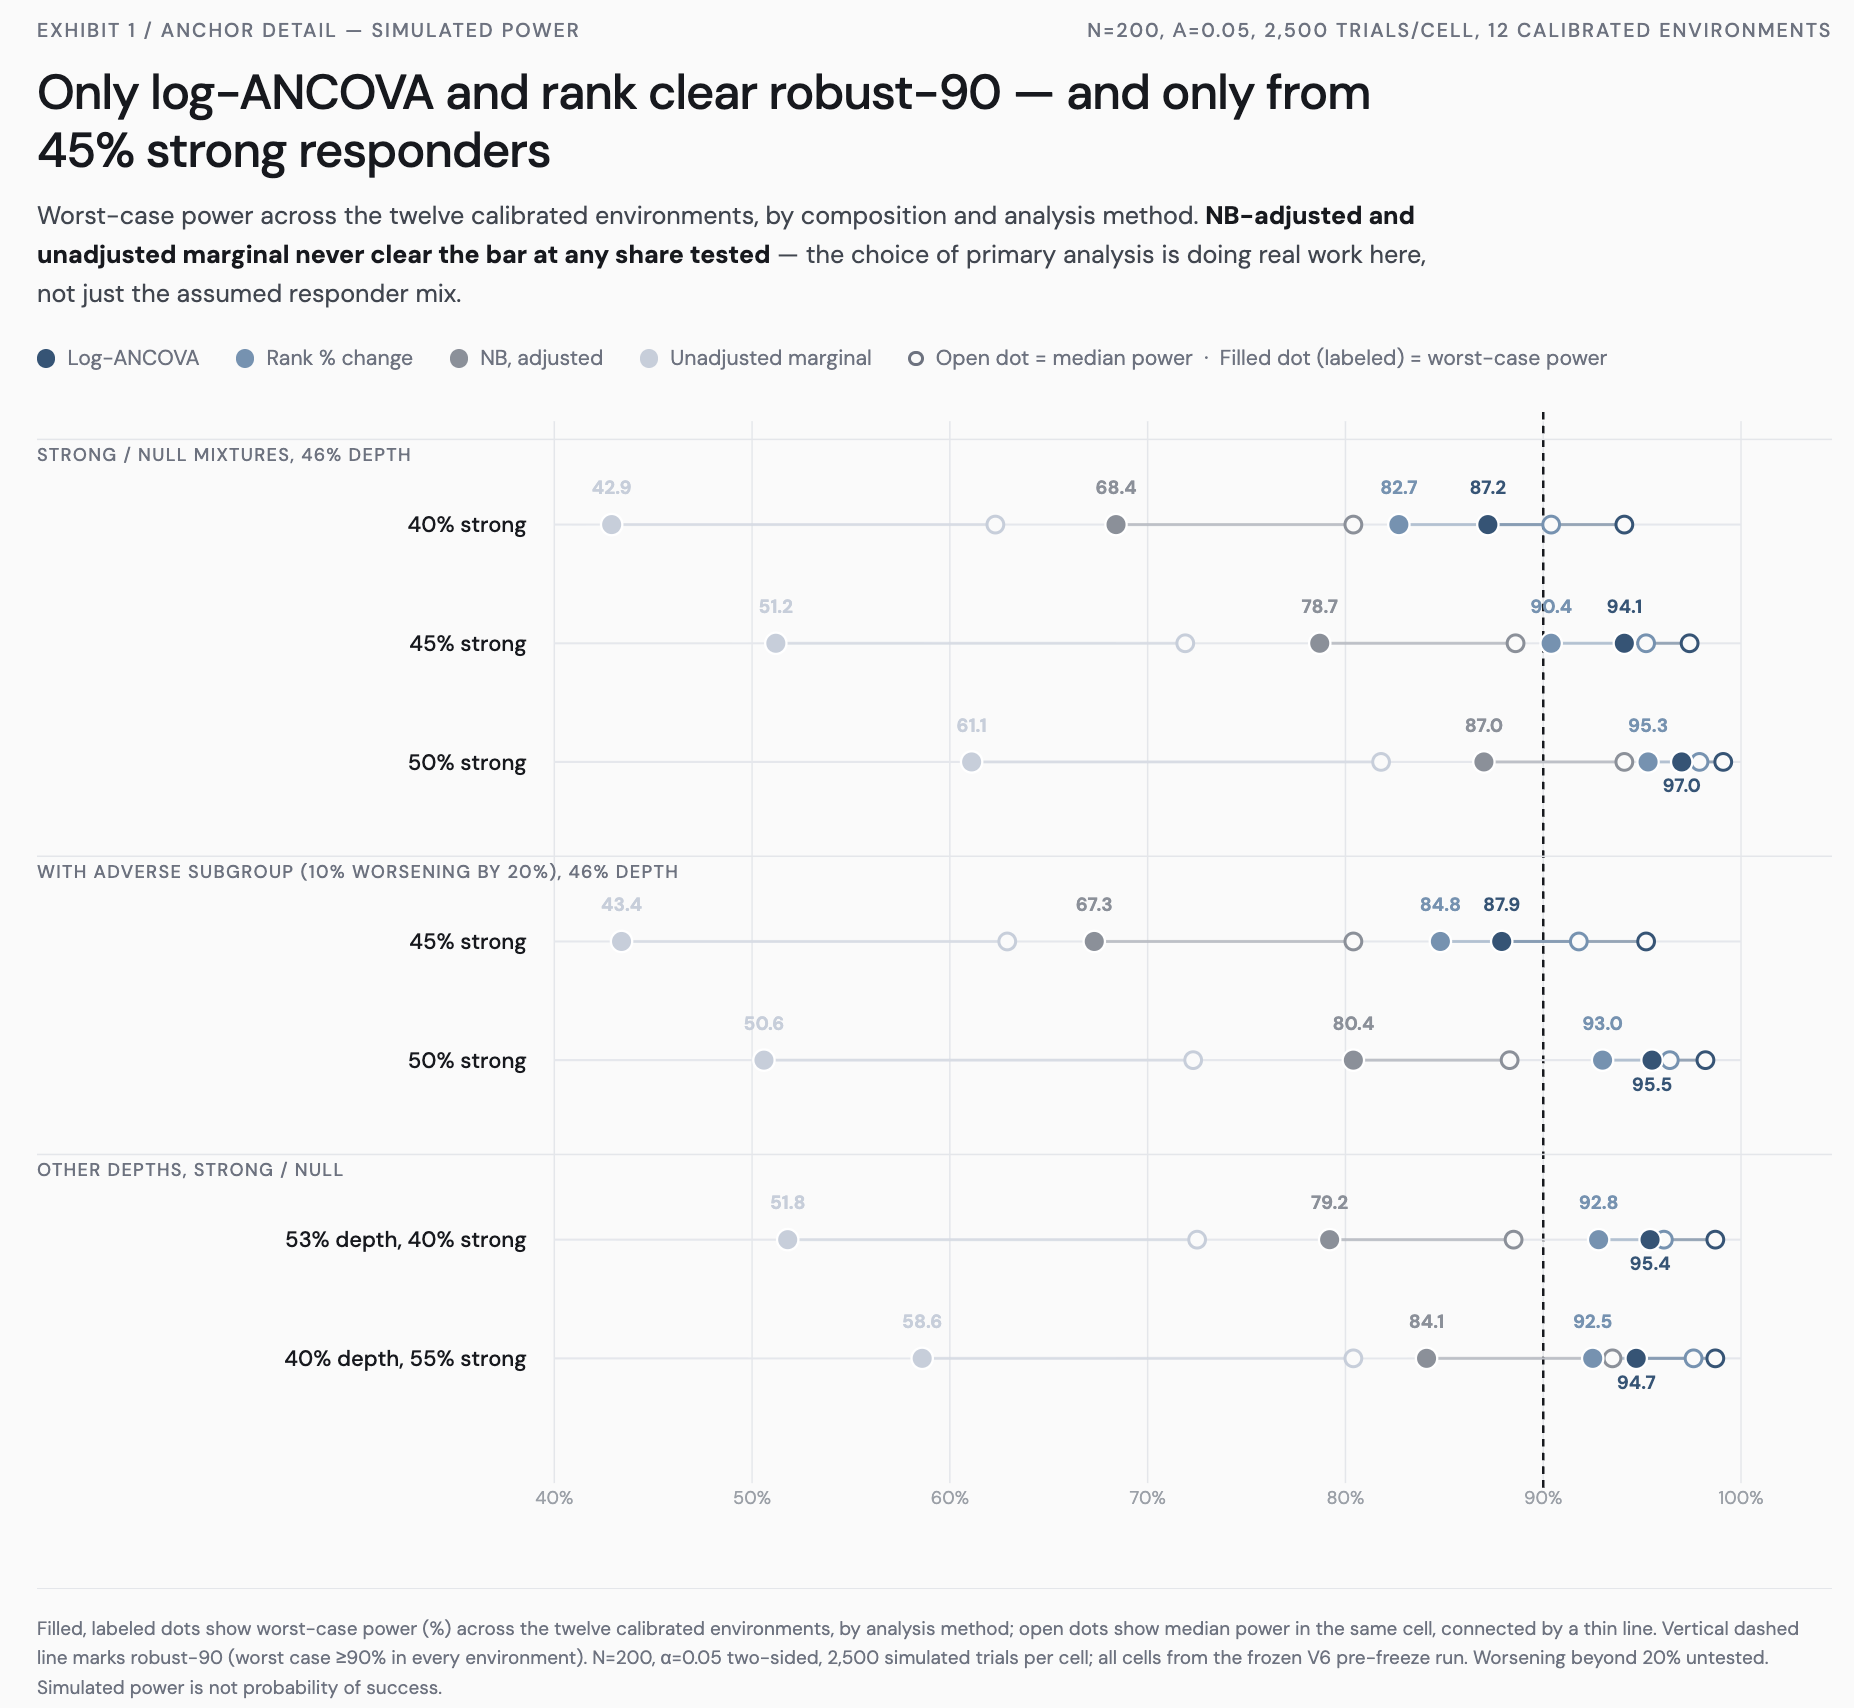
The break-point: ~45% strong responders. At 46% within-responder efficacy, assuming everyone else gets no benefit at all. At EMBOLD’s observed 53% the requirement falls to 35–40%; at the 40% stress case it rises to 50–55%. The assumption is deliberately harsh.
-
The illustrative base mix: 30% strong, 35% partial, 35% null, with partial responders getting a 25% reduction. It clears robust in every environment on the analyses we consider most likely, despite strong responders being well below 45%.
-
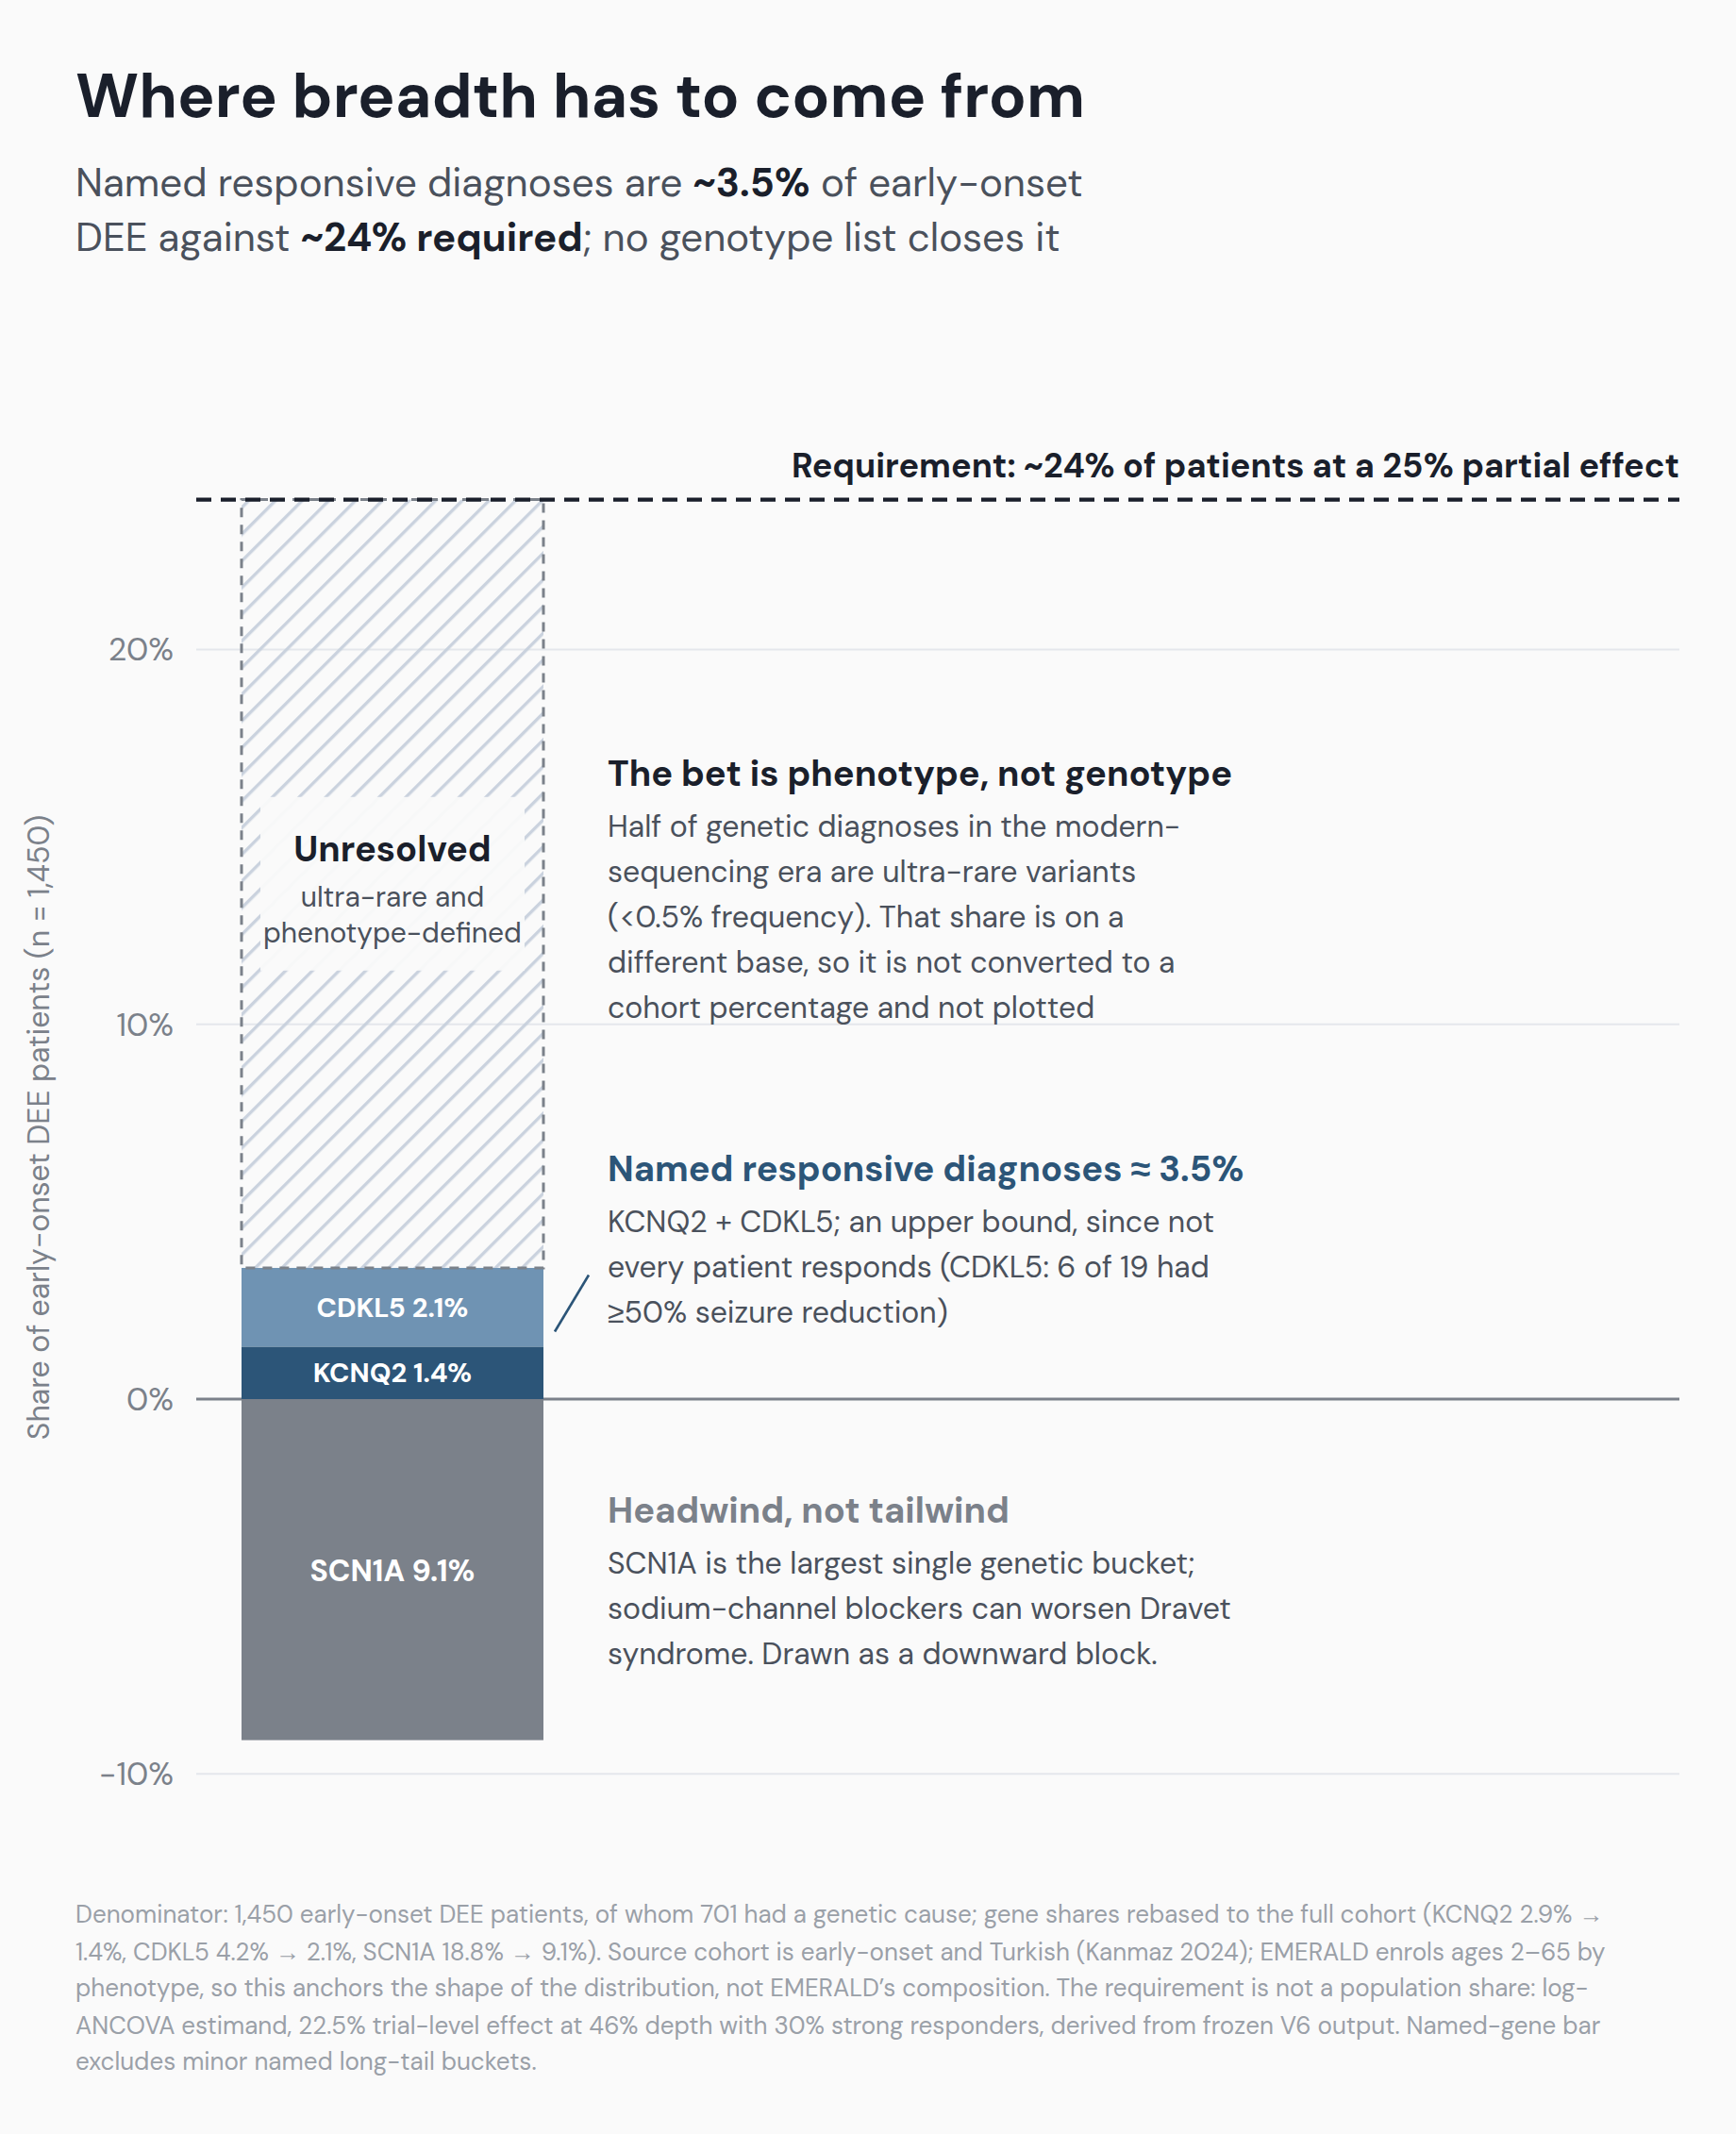
The minimum partial requirement: ~24%. On the trial’s own analysis scale, at 46% depth with 30% strong responders, roughly a quarter of patients with a 25% reduction (about half the central depth) is enough to reach the hurdle. That is well below both the third our base case assumes and what naive averaging of percent reductions would imply. This is the reference breadth requirement §5 must make biologically plausible under the central log-analysis scenario; other depth and prevalence combinations reach the same hurdle.
 Open full resolution ↗
Losing depth is survivable. Losing depth and breadth together is not. A seven-point fall in depth costs between five and ten points of breadth depending on which analysis is used, and the relationship stays smooth across the range we tested.
Partial response is where the risk concentrates. Cut the assumed partial benefit from 25% to 15% and the weakest environment still holds on the analyses that track the typical patient but falls below the bar on an adjusted count model. Add a 10% adverse subgroup — patients who get worse, the Dravet risk — and the typical-patient analyses again hold, narrowly. Appendix has the values. Neither stress alone breaks the trial on the analyses that track the typical patient; together, they do. That is the biological failure state: thin partial benefit plus a real adverse tail. The second gate is measurement: on count-based analyses the cushion is already gone before either stress hits, so even a favourable mixture can fail to register (§6).
5. Can biology supply the breadth?
Biology can address existence. It cannot say how many such patients EMERALD enrolled.
The evidence here is class evidence, not drug evidence. Nearly every citation below is an older sodium-channel blocker, not relutrigine, tested in heavily pretreated patients. It shows sodium-channel sensitivity beyond SCN2A/8A; it does not show relutrigine captures it. Relutrigine’s differentiation claim — preferential block of the persistent sodium current, sparing inhibitory neurons — is untested in adverse genotypes such as Dravet.
Proof of principle exists. KCNQ2 encodes a potassium channel, not a sodium channel. A 2026 international cohort still found older sodium-channel blockers among its most effective treatments. Earlier initiation was tied to better outcomes. That is scope, not scale. Gene-by-gene detail is in Appendix. Within CDKL5 alone, response splits three ways: 6 of 19 patients on sodium-channel blockers had seizures at least halved, four seizure-free. Most saw no benefit. Three got worse. Strong, null, adverse. That is exactly what our simulation assumes.
Known responsive genes cannot carry the required breadth. KCNQ2 is about 1.4% of the largest national early-onset cohort. CDKL5 is about 2.1%. EMERALD needs roughly 24% (§4), and these prevalences are not additive against that requirement. Named genes are far too small on their own. The real bet is that sensitivity tracks phenotype, not a specific gene. A 2026 multicentre study selected infants by phenotype and excluded KCNQ2 entirely. All 11 of 11 severely affected patients responded at least partially. The cohort was hand-picked. It proves the phenomenon can occur, not its frequency. That frequency is what EMERALD tests.
 Open full resolution ↗
Risk runs the other direction too. Sodium-channel blockers can worsen Dravet syndrome. SCN1A is about 9% of the national cohort, too large to wave away. EMERALD’s own Dravet/SCN1A exposure is undisclosed. Our 10% adverse-subgroup stress assumption costs a few points of power. Whether relutrigine’s selectivity actually mitigates this is unproven.
Management commentary shifts the prior only slightly. Pooled blinded data “departing from historical expectations” cannot identify a treatment effect. Claims about site cross-enrollment or a favorable etiology mix are neither verifiable pre-topline nor evidence of efficacy.
Net: biology passes a plausibility test, not a prevalence test. What remains is whether the primary analysis can detect the mixture, if it is there.
6. Could a Real Effect Still Print as a Miss?
A favourable mixture still has to register in the primary analysis. Praxis has not disclosed the method. It is the largest remaining unknown.
Analyses of the typical patient’s improvement support the thesis comfortably. An analysis that totals seizure counts does not, because patients with very high counts dominate the arithmetic. The exhibit below gives the spread.
The same trial prints about five points lower on a median-change scale than on the log scale. It prints two to three points lower on count-based scales. Count-based analyses also lose power faster than their point estimates fall. A handful of very high-count patients carry the variance.
The estimand problem is not only a simulation artefact. PACIFIC, Lundbeck’s 52-patient bexicaserin study in broad DEE, was positive on its prespecified rank test of patient-level percent change; a post-hoc mean-count analysis was not. Praxis has been on both sides of the same choice — a log model in EMBOLD, median percent change in POWER1, where vormatrigine missed the primary but hit the responder-rate secondary. Its own history doesn’t settle which EMERALD will use.
7. Not Every Positive Print Is Worth the Same
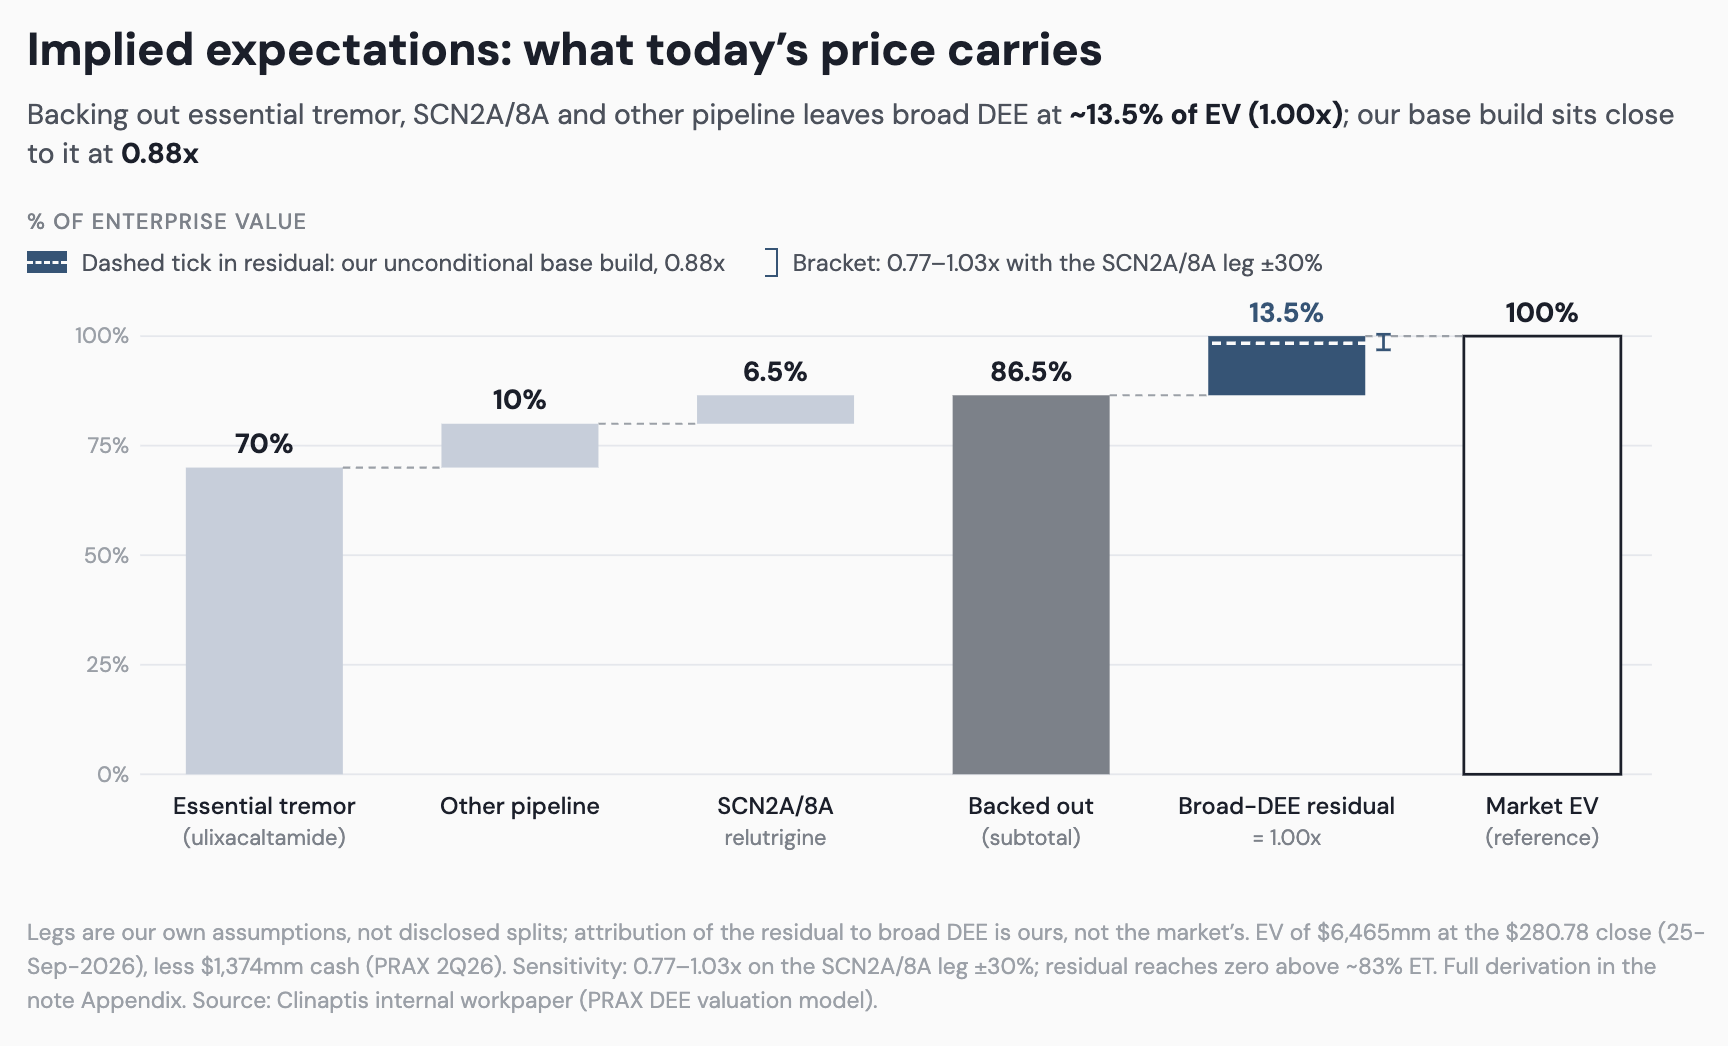
Today, strip essential tremor, SCN2A/8A relutrigine, and the rest of the pipeline from enterprise value. What is left is the residual we attribute to broad DEE. We set it to 1.0x as the anchor — a subtraction of our own assumptions, not an allocation Praxis or the market discloses. Our unconditional build values it at about 0.9x.
 Open full resolution ↗
The headline number will be interpreted before anyone knows how it was calculated. Two things decide what it is worth: whether the primary clears, and whether the reduction is broad or concentrated.
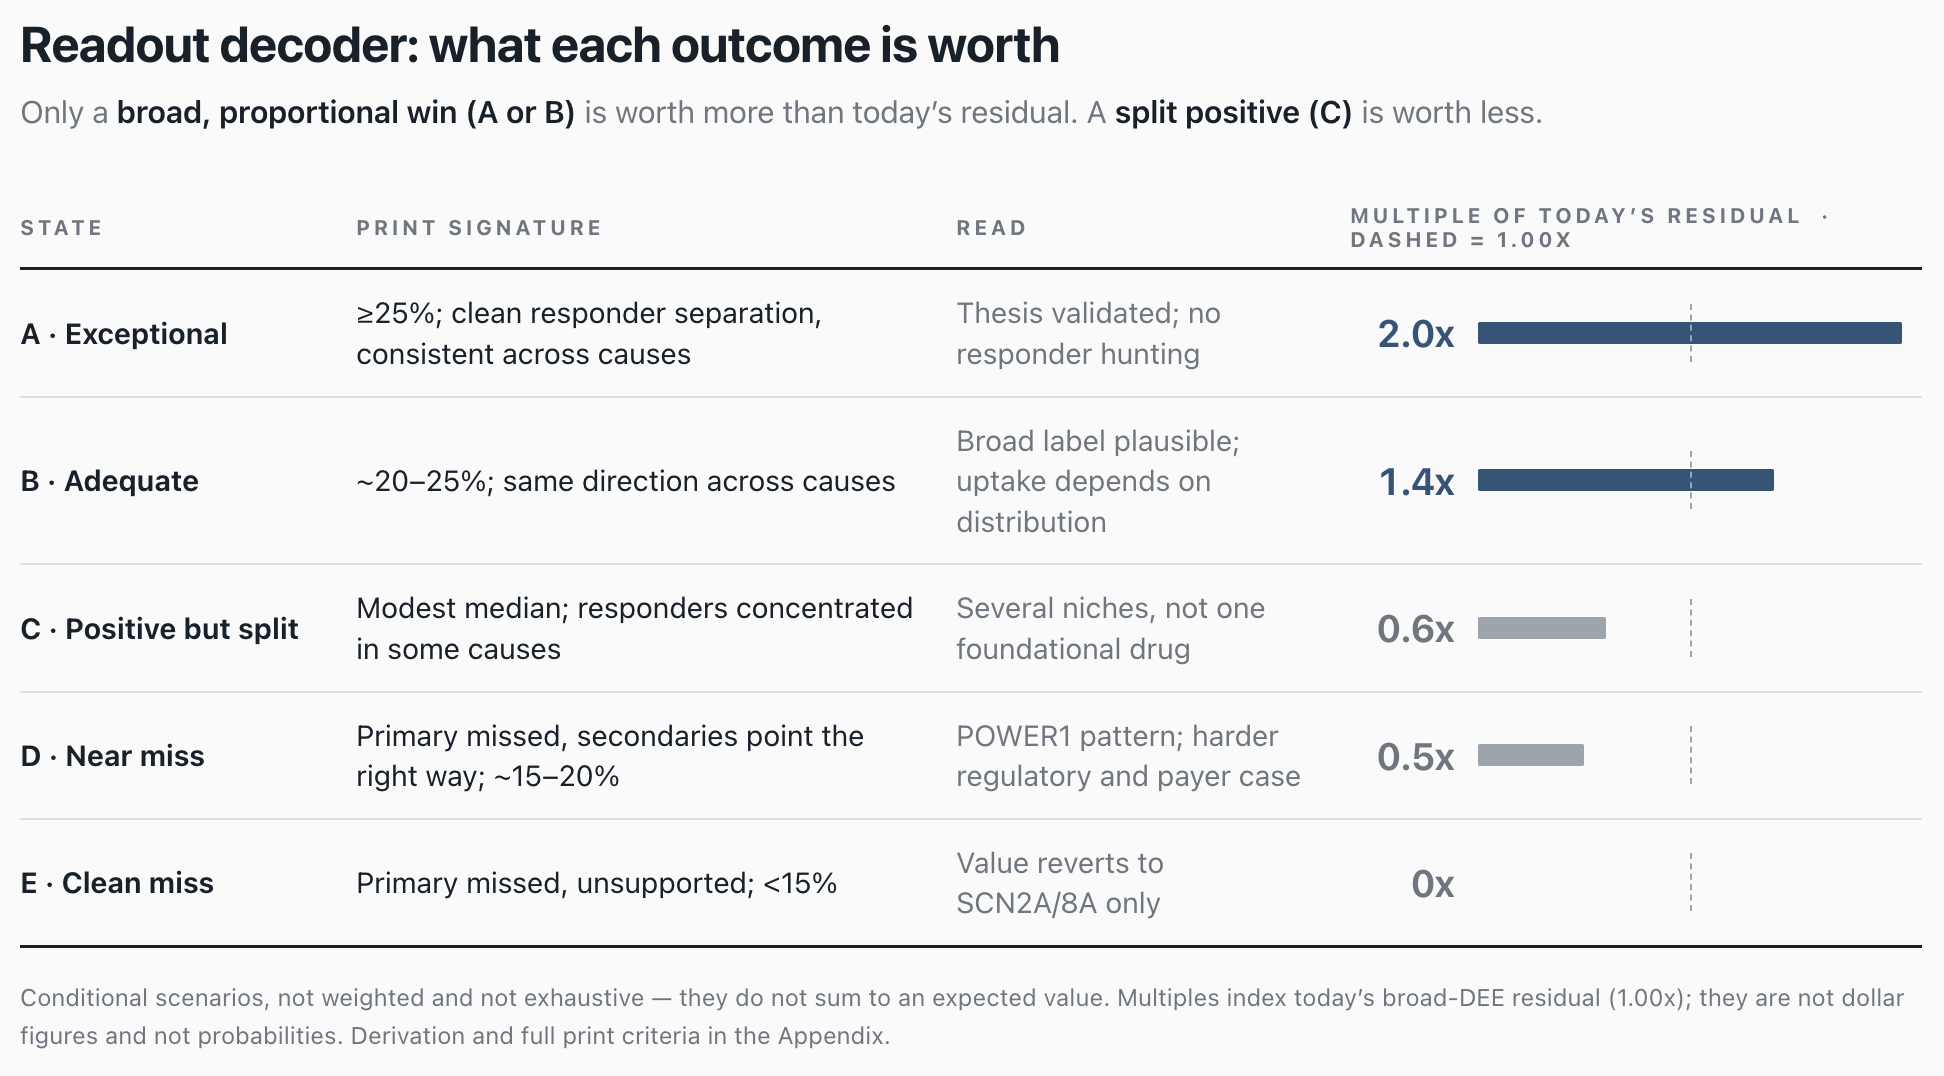
The prespecified primary endpoint on the primary method decides success or failure, and nothing in the secondaries reverses it. But the primary only decides the sign. The distribution decides franchise quality — median change, ≥50% responder rate, placebo response, subtype consistency, loss-of-function safety, and discontinuations for lack of efficacy. Magnitude bands are guides, not state definitions: A and B differ on proportional efficacy, responder separation, and safety across loss-of-function disease, not on significance. A statistically clean but split response (C, ~0.6x) can be worth more than a noisy near-miss (D, ~0.5x), even at a smaller headline effect, because C still supports an identifiable commercial population.
Five states, and what each is worth against that anchor:
 Open full resolution ↗
The multiples are valuation outcomes conditional on each clinical state, not probabilities, and they do not sum to an expected value. The residual itself is sensitive to the value assigned to essential tremor and SCN2A/8A — treat 1.0x as an implied-expectations anchor, not a precise market valuation.
8. Bottom line
EMERALD doesn’t need EMBOLD’s 53%. It needs the §4 breakpoint: ~45% strong responders alone, or 30% strong plus ~24% partial. Biology makes that mixture plausible. It doesn’t establish how common it is.
Two things stay unresolved until topline: did EMERALD enroll enough responsive biology, and does the undisclosed primary analysis actually capture that mixture.
On our attribution, today’s price sits about 10% above our unconditional value for broad DEE. Positive data isn’t automatically upside — only a broad, proportional win is worth more than the anchor; a split positive is worth less, at ~0.6x. The clinical bar is lower than the 53% framing implies. The investment bar is higher.
Appendix
This appendix is an assumption-and-sensitivity record, not a reproduction package. It states the inputs we chose, the thresholds we held ourselves to, and how the conclusions move when those inputs change. It does not publish the seizure-count distributions, missing-data rules or simulation code.
Methodology
 Open full resolution ↗
-
Virtual EMERALD: N≈200, 16-week parallel, α=0.05; twelve calibrated environments varying seizure-count dispersion and placebo response; 2,500 simulated trials per cell at the boundary. Primary read is a baseline-adjusted log-count model (log-ANCOVA); rank / percent change, adjusted count (NB) and unadjusted marginal are alternates.
-
“Robust” = ≥90% power in every one of the twelve environments. Power is not probability of success; a probability of success requires a prior over depth and breadth, and we assert none.
-
Log-analysis power, median across environments [min–max]: 15% efficacy 69.4 [56.0–80.2]; 17.5% 83.5 [72.8–92.1]; 20% 92.3 [83.6–97.3]; 22.5% 96.9 [92.1–98.9]; 25% 99.2 [97.1–99.9].
-
Breakpoints with a null remainder (robust, 53 / 46 / 40% depth): log 35 / 45 / 50%; rank 40 / 45 / 55%; adjusted count ~50% at 46% depth (87% weakest environment at 50%, so at or just above the tested edge); unadjusted marginal not reached anywhere in the grid, with an elevated false-positive rate, the harshest possible reading.
-
Base mix at 46% depth (30% strong / 35% partial at 25% / 35% null), power median / weakest environment: log 98.8 / 95.4; rank 97.4 / 93.3; adjusted count 95.2 / 86.0; unadjusted marginal 82.6 / 61.2.
-
Stresses on the base mix (weakest environment): partial benefit 25%→15%: log 91.5, rank 88.3, adjusted count 80.6, marginal 51.3. 10% adverse subgroup worsening 20% (30% strong): log 92.5, rank 89.6, adjusted count 77.1, marginal 52.6.
-
The ~24% partial requirement comes from frozen V6 output on the log-ANCOVA estimand, where the trial-level effect is the weighted geometric mean of patient-level rate ratios: 22.5% at 46% depth with 30% strong responders needs roughly 24% of patients at a 25% partial effect, or any equivalent combination of prevalence and depth. Averaging percent reductions matches no estimand in the simulation and overstates the requirement by 10–15 points. The formula predicts effect size, not power: a spiky strong/null mixture loses three to four points of power against a homogeneous trial of the same effect size; the smoother base mix loses almost nothing.
 Open full resolution ↗
Background
-
EMBOLD Cohort 2: 53 unique participants, staggered-placebo design (placebo n=25, drug n=51); 53% placebo-adjusted, p<0.0002; 74% SCN8A / 26% SCN2A; 99% onset within twelve months; roughly two-thirds on three to six other antiseizure medicines; stopped at a planned interim for efficacy, December 2025. Cohort 1: 46%, p=0.035. Both are back-transformed effects from a log seizure-frequency analysis (Cohort 2 ≈ rate ratio 0.47). AES 2025, AAN 2026 posters.
-
PDUFA December 27, 2026 (moved from September 27 after a major amendment; 8-K, June 29, 2026). Mid-cycle: no major issues; no advisory committee. Broad-DEE sNDA guided to 2027, contingent on approval.
-
EMERALD: N≈200 (original plan ~160), ages 2–65, >50 etiologies plus non-genetic cases, ≥4 countable motor seizures per 28 days (median >50), ≤2 background sodium-channel blockers, 1 mg/kg/day with escalation to 1.5 mg/kg/day permitted at day 35, 16-week double-blind period; primary endpoint change in monthly motor-seizure frequency. Statistical method undisclosed.
-
PACIFIC (bexicaserin), n=52, 56% Lennox-Gastaut, 37% other DEE, 8% Dravet: median −59.8% vs −17.4% placebo; ≥50% responders 60% vs 33%. Prespecified rank test on patient-level percent change positive; post-hoc mean count-rate analysis not.
-
POWER1 (vormatrigine): missed median percent change primary, met ≥50% responder secondary; arm-level data undisclosed. POWER2/3 guided to restart 4Q26 with amended designs.
-
DEEp OCEAN (NCT06719141): randomised, double-blind, parallel placebo; enrolment 367; 15 weeks (3 titration + 12 maintenance); primary percent change in countable motor-seizure frequency; method undisclosed; readout end-2026 / 1Q27.
-
Patient counts and >$5B peak sales are management claims (Q2 call, August 6, 2026; August 2026 corporate presentation). We publish no peak-sales forecast.
Model assumptions
-
Depths 53 / 46 / 40%; placebo ~18%. Base mix as above.
-
Adverse subgroup: 10% of patients worsening by 20%, costing 2–9 points of weakest-environment power on log and rank depending on the strong-responder share (more cushion, smaller cost); up to ~11 points on the adjusted count model.
-
Decoder bands are on the log scale. At 46% depth with 45% strong responders, ~23.8% on log ≈ 18.9 points on median percent change. Base mix: log 24.5 / median change 19.8 / count-based 22.6. The ≥25% cut is an underwriting convention, not a regulatory threshold. A median-scale band set should be built once the primary method is known.
-
Multiples: each state’s multiple = reachable pool × state penetration × state net price × emergent NPV/peak multiple × post-print probability of approval and a usable label, divided by the market-implied residual; computed in an internal workpaper. Penetration and price move together across states by construction (both driven by label breadth), so the range is a set of coherent worlds, not a confidence interval; state A stacks three favourable assumptions rather than one. State C is the least evidenced (one commercial analogue) and inverts from worst to attractive if responders prove identifiable prospectively. These are conditional statements, not a distribution: the states are not exhaustive, not weighted, and must not be read as one. No currency figure is published.
-
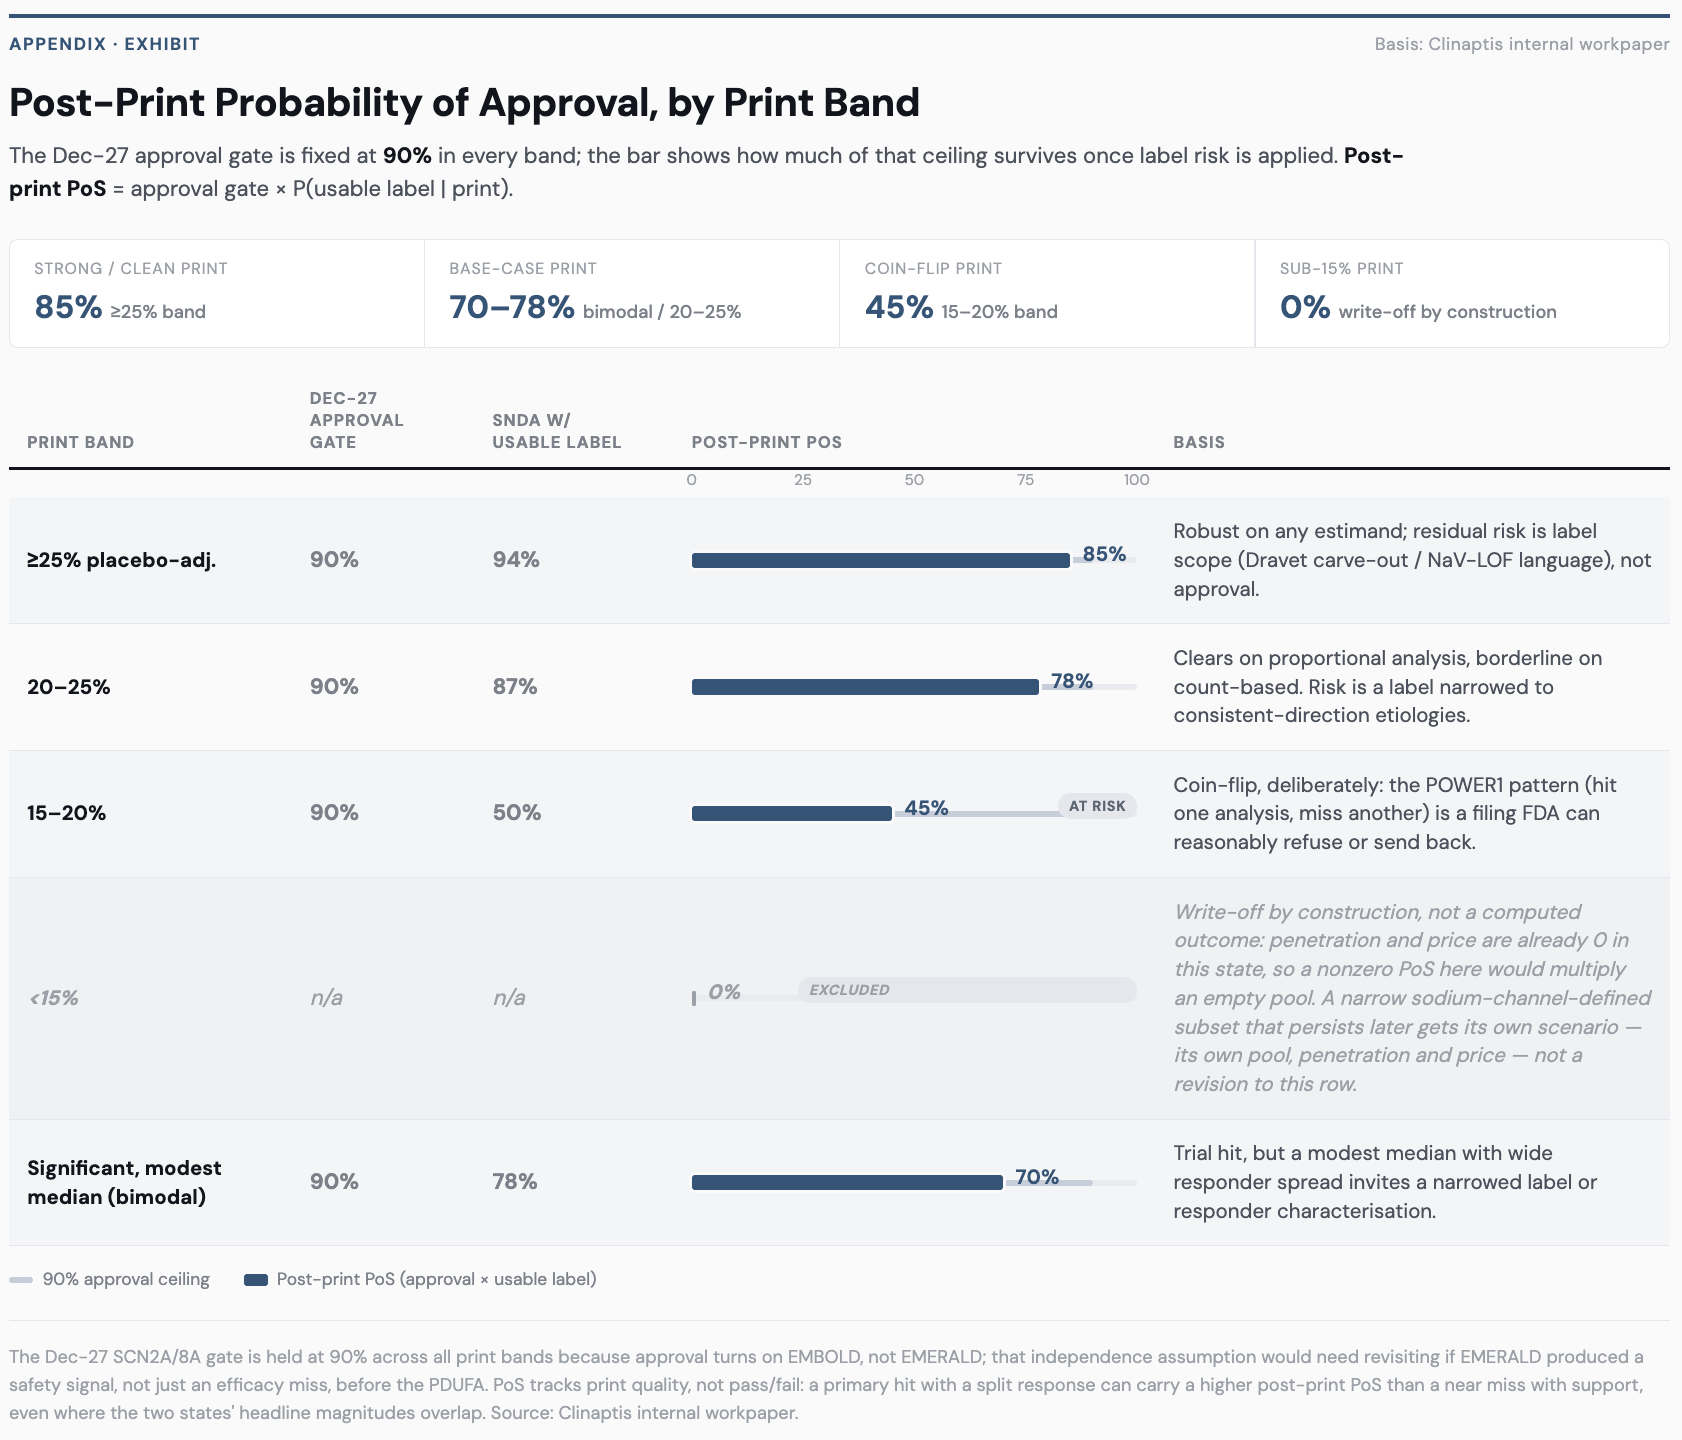
Post-print probability of approval, disaggregated: P(Dec-27 SCN2A/8A approval) × P(sNDA with a usable label | print). The Dec-27 gate is held at 90% across print bands because approval turns on EMBOLD, not EMERALD; that independence assumption would need revisiting if EMERALD produced a safety signal, not just an efficacy miss, before the PDUFA.
 Open full resolution ↗
PoS tracks print quality, not pass/fail: a primary hit with a split response (State C) carries a higher post-print PoS than a near miss with support (State D), even where the two states’ headline magnitudes overlap.
Valuation anchor
-
Enterprise value of $6,465mm at the $280.78 close on 25-Sep-2026 (market cap $7,838mm; 27.9mm shares outstanding), less cash of $1,374mm (PRAX 2Q26). Subtracted in order, as shares of enterprise value: ulixacaltamide in essential tremor 70% (our assumption, from our published ET model); other pipeline 10% (our assumption); SCN2A/8A relutrigine ~6.5% (a read-through: peak sales × the broad-DEE emergent multiple × PoS, not a build). Residual ~13.5% of enterprise value = 1.00x. The attribution of that residual to broad DEE is ours, not the market’s; no disclosure supports it.
-
Our unconditional forward build: 0.88x. SCN2A/8A leg ±30%: 0.77–1.03x; the in-line reading flips above ~8% of enterprise value for that leg. ET share: ±5 points of enterprise value moves the residual ~37%; the residual reaches zero above ~83% ET (reversal point). The residual is a subtraction and inherits the error in every leg removed from it; because every conditional multiple shares it as denominator, all five rise or fall together.
Evidence for sodium-channel pharmacosensitivity across DEE etiologies
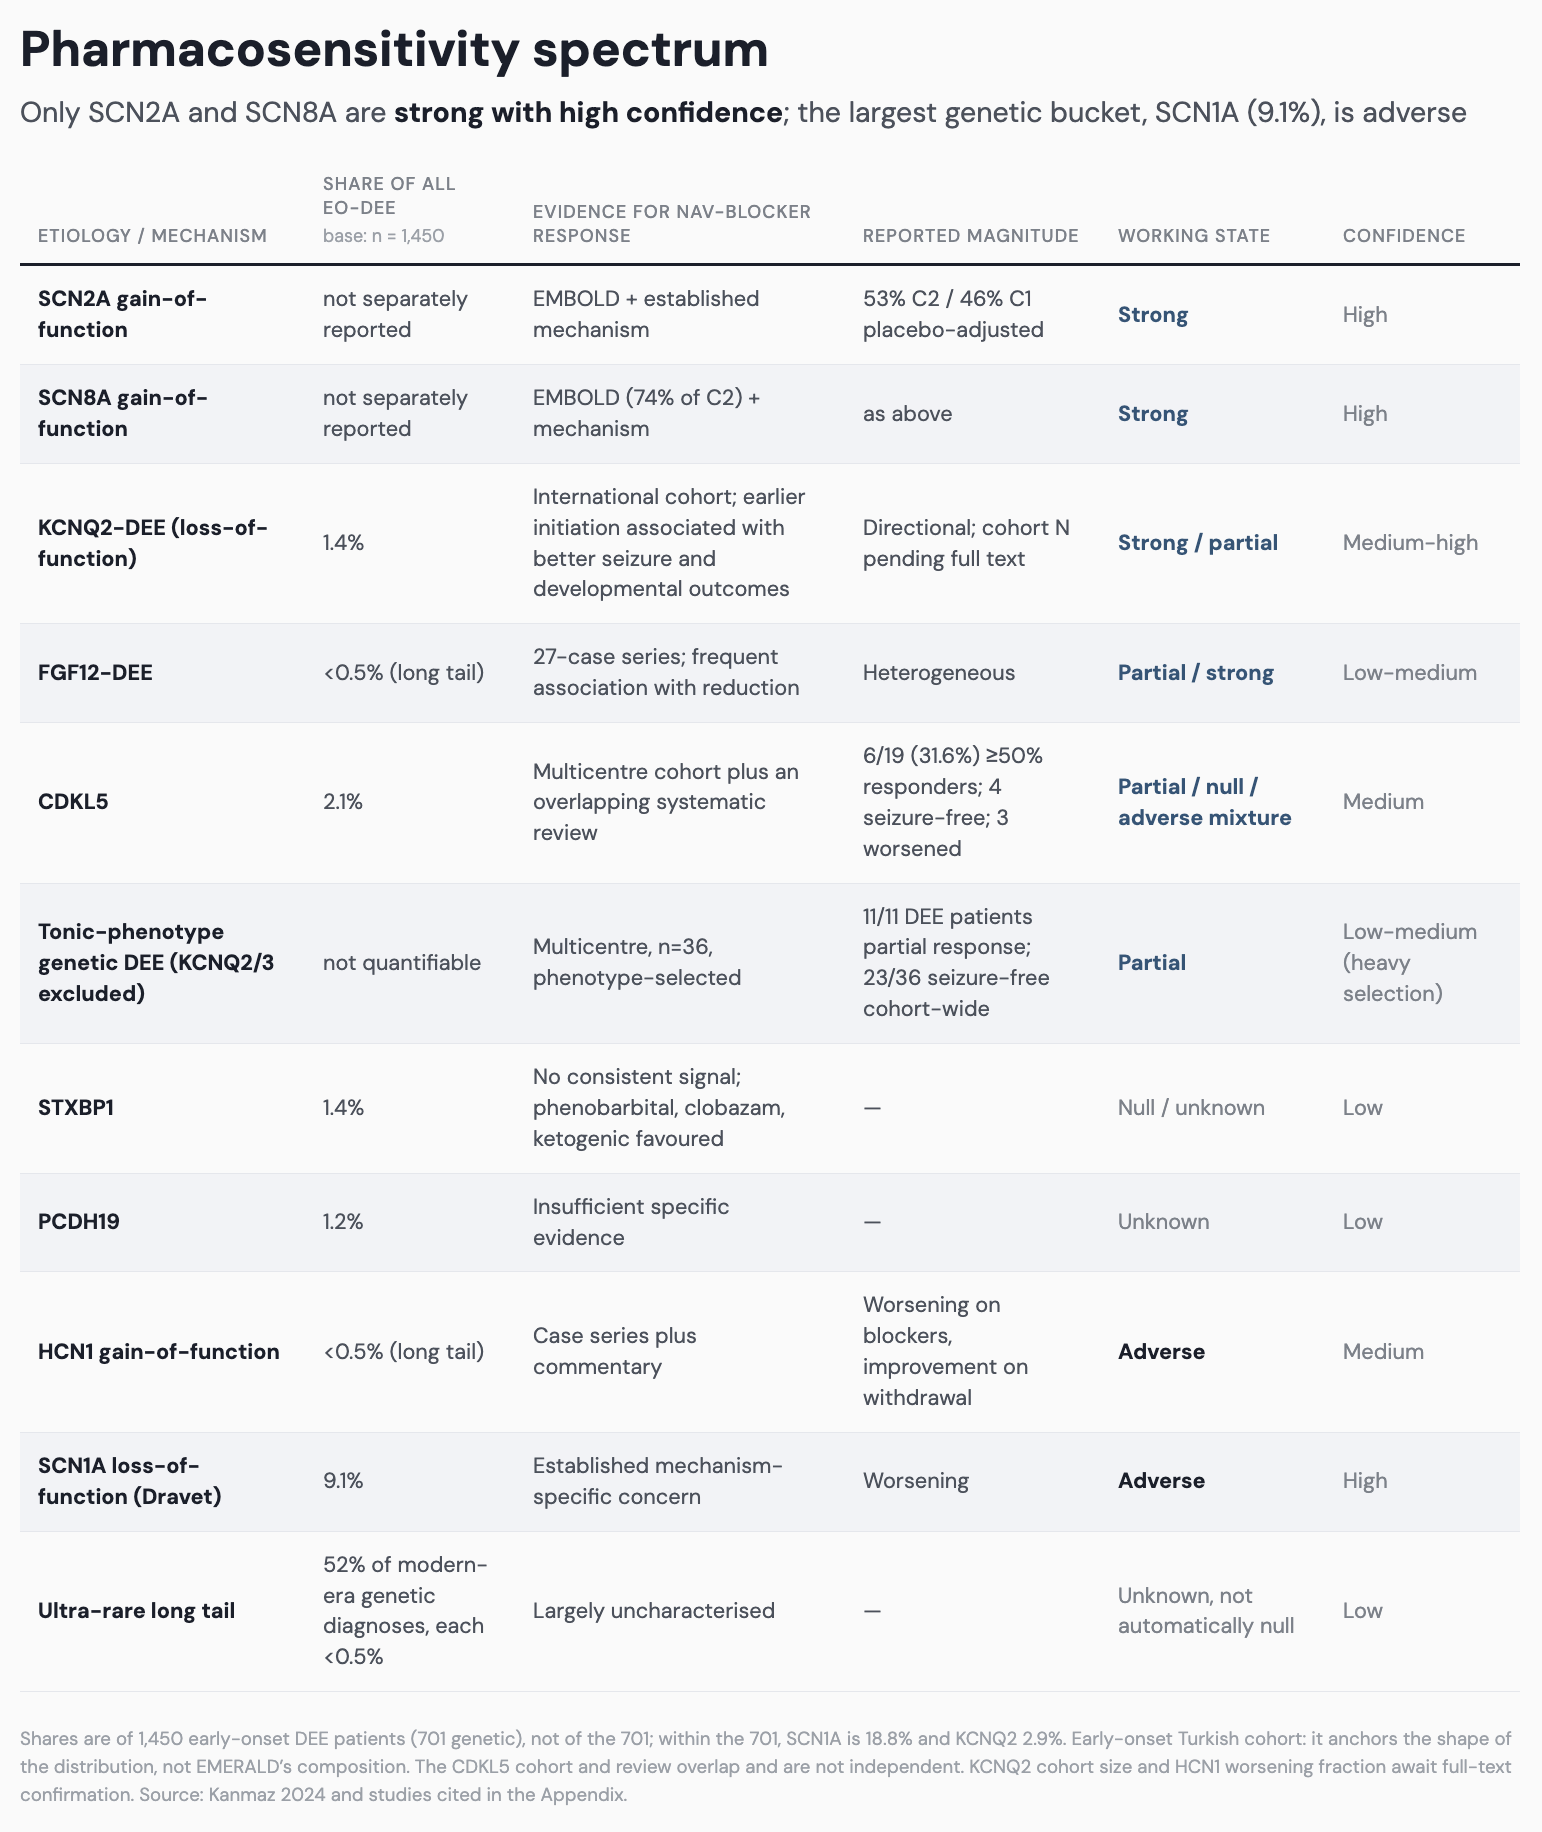 Open full resolution ↗
-
CDKL5 (Epilepsy & Behavior 2021): the response split is given in §5. A 2025 systematic review reporting a similar ~30% rate draws on overlapping patients and is not independent evidence.
-
Phenotype-selected cohort (Carapancea et al., Seizure 2026): n=36, onset under 12 months, predominantly tonic, KCNQ2/3 excluded; 11/11 with DEE responded partially; 23/36 seizure-free and 13/36 with ≥50% reduction; no worsening. Selected on phenotype, so not a prevalence estimate.
-
Adverse genotypes: SCN1A loss-of-function (Dravet) is 9.1% of all early-onset patients and 18.8% of genetic diagnoses; not all SCN1A disease is classic loss-of-function Dravet. HCN1 gain-of-function: worsening on blockers and improvement on withdrawal (Lelli et al., Dev Med Child Neurol 2026); we cite the direction of the finding rather than the affected fraction.
-
Prevalence base (Kanmaz et al., Seizure 2024): 1,450 early-onset patients, Turkish; 701 with a genetic cause; half of modern-era genetic diagnoses are ultra-rare variants under 0.5% frequency each. Gene shares are rebased to the full cohort. It anchors the shape of the distribution, not EMERALD’s composition (ages 2–65, phenotype-selected).
-
Denominator comparability: each responsive diagnosis contains its own strong, partial, null and adverse responders, so prevalences are not additive against the ~24% requirement. Four quantities should not be confused: the diagnosis’s share of a national early-onset cohort, how many enrol in EMERALD, how many of those would worsen on relutrigine, and the adverse fraction we modelled. They can diverge either way. Phenotype selection could enrol Dravet above its population share; the two-blocker cap and management’s routing comments push the other way. The 10% adverse subgroup is the same order of magnitude as the SCN1A share, not a calibration to it.
-
Mechanism: relutrigine’s proposed differentiation is discussed in §5. EMBOLD enrolled gain-of-function channelopathies, where any sodium-channel blocker should work; no Dravet patient has been dosed in a controlled trial.
Sources
-
Millevert C, Gembicki R, et al. Brain, Aug 18, 2026; doi:10.1093/brain/awag277 (KCNQ2).
-
Epilepsy & Behavior 2021, PMID 33848848 (CDKL5; see Appendix Evidence for findings).
-
Kanmaz S, Tekgul H, Kayilioglu H, et al. Seizure 2024;123:17–25; doi:10.1016/j.seizure.2024.09.021. KCNQ2 2.9% / CDKL5 4.2% of gene-related cases (1.4% / 2.1% of cohort); SCN1A 18.8% / 9.1% (see Appendix Evidence for cohort description).
-
Carapancea E, Semal B, Mercier N, et al. Seizure 2026;142:230–239; doi:10.1016/j.seizure.2026.08.028 (see Appendix Evidence for findings).
-
Lelli et al. Dev Med Child Neurol 2026; doi:10.1111/dmcn.70368, commentary doi:10.1111/dmcn.70369 (HCN1).